LBank has now completed the integration of its futures data with TradingView. Users can access real-time LBank futures chart data directly on TradingView, leveraging a wide range of charting tools and technical indicators to support in-depth technical analysis and informed trading decisions.
Here’s a quick guide on how to access LBank futures data on TradingView.
Step-by-Step Guide
Web
1. Go to TradingView
Open your browser and visit: https://www.tradingview.com.
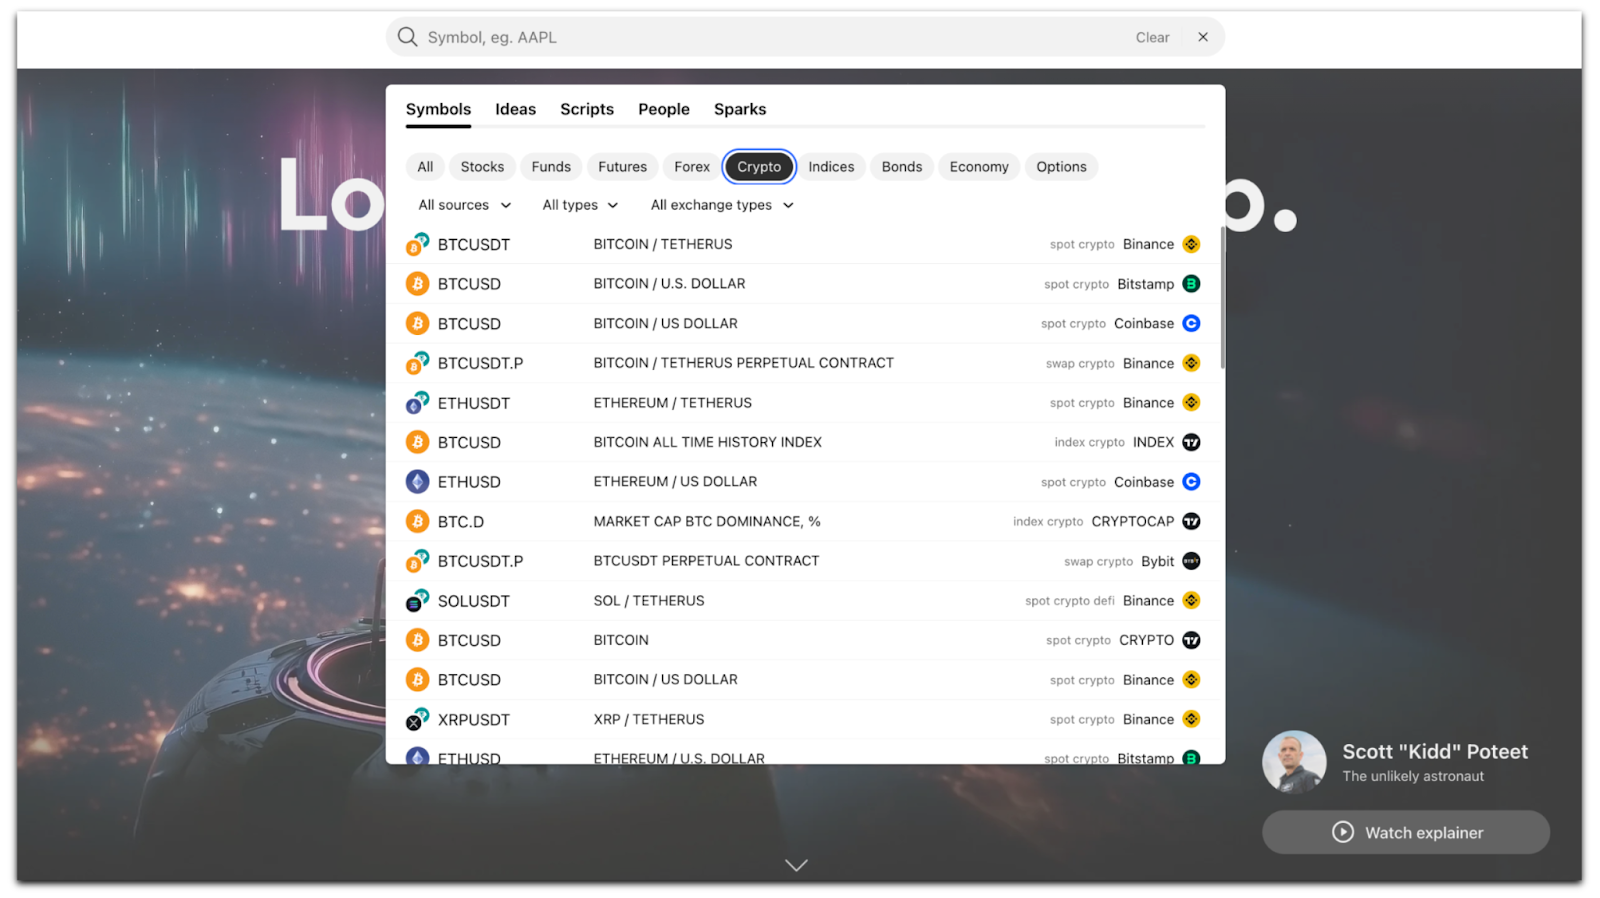
2. Open the Supercharts Interface
- In the top search bar, select [Crypto], then tap [All Sources].
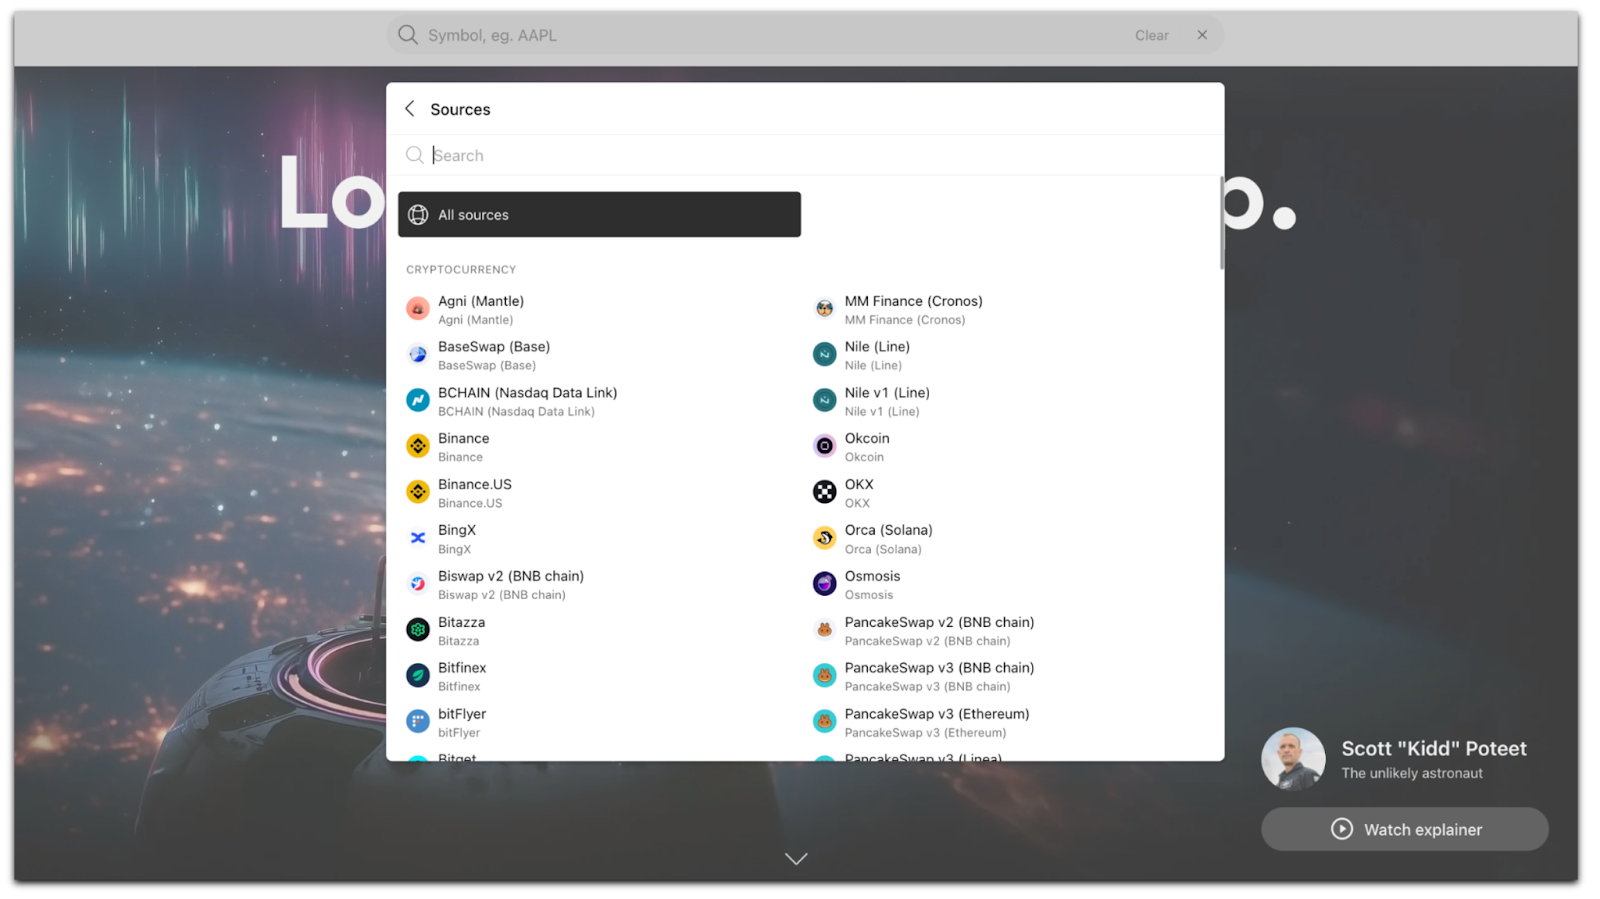
- Search for [LBank] on TradingView to access data for all LBank futures trading pairs.
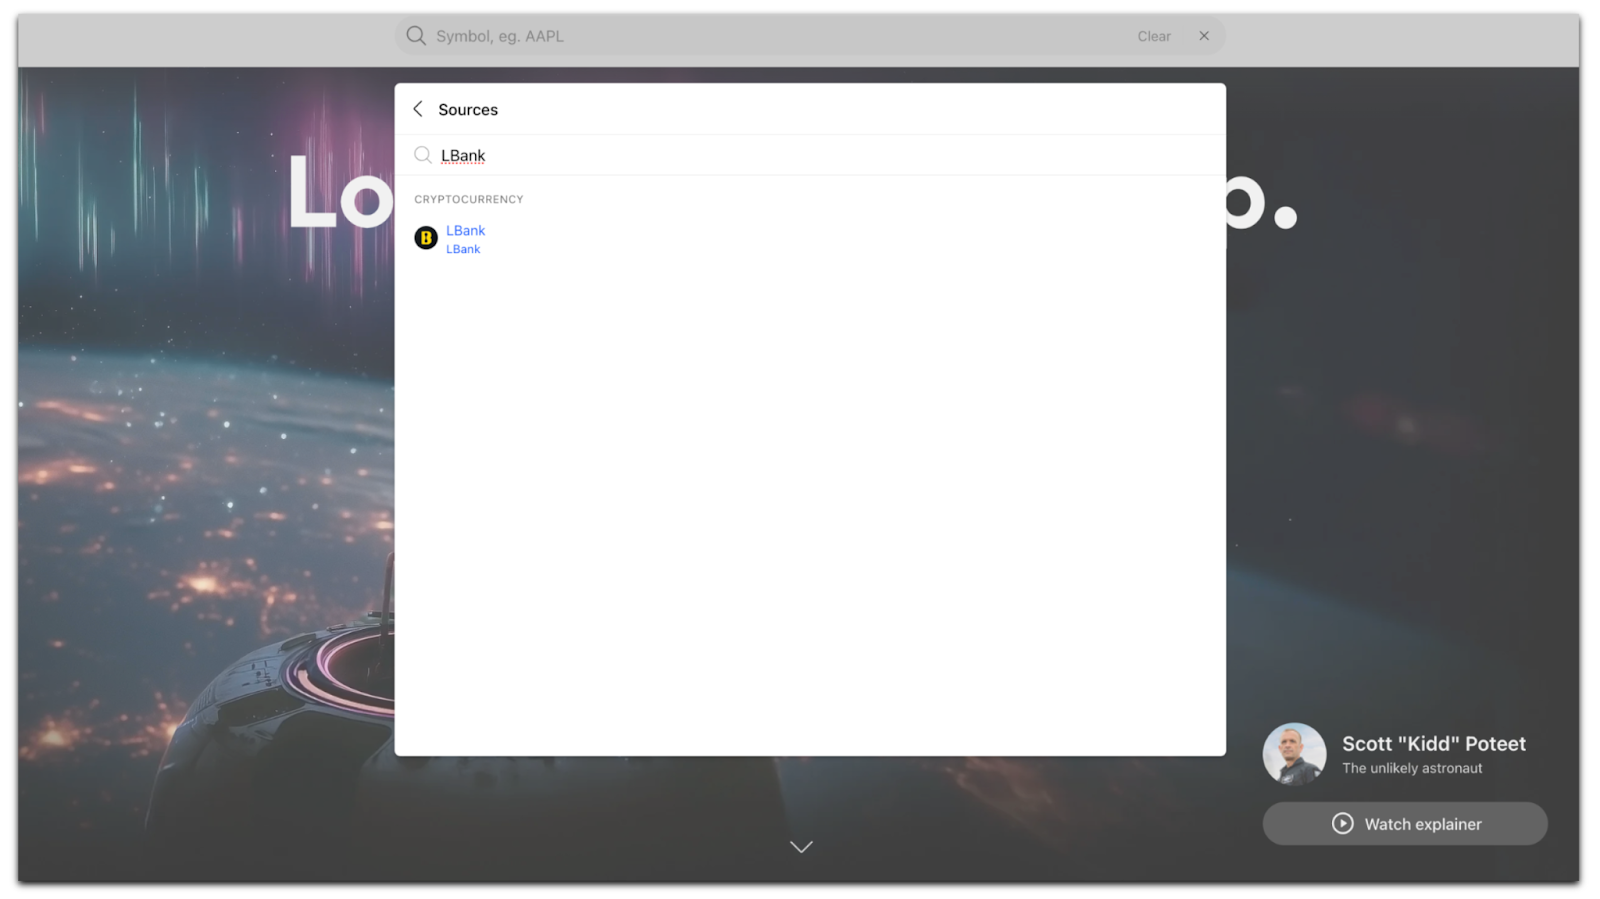
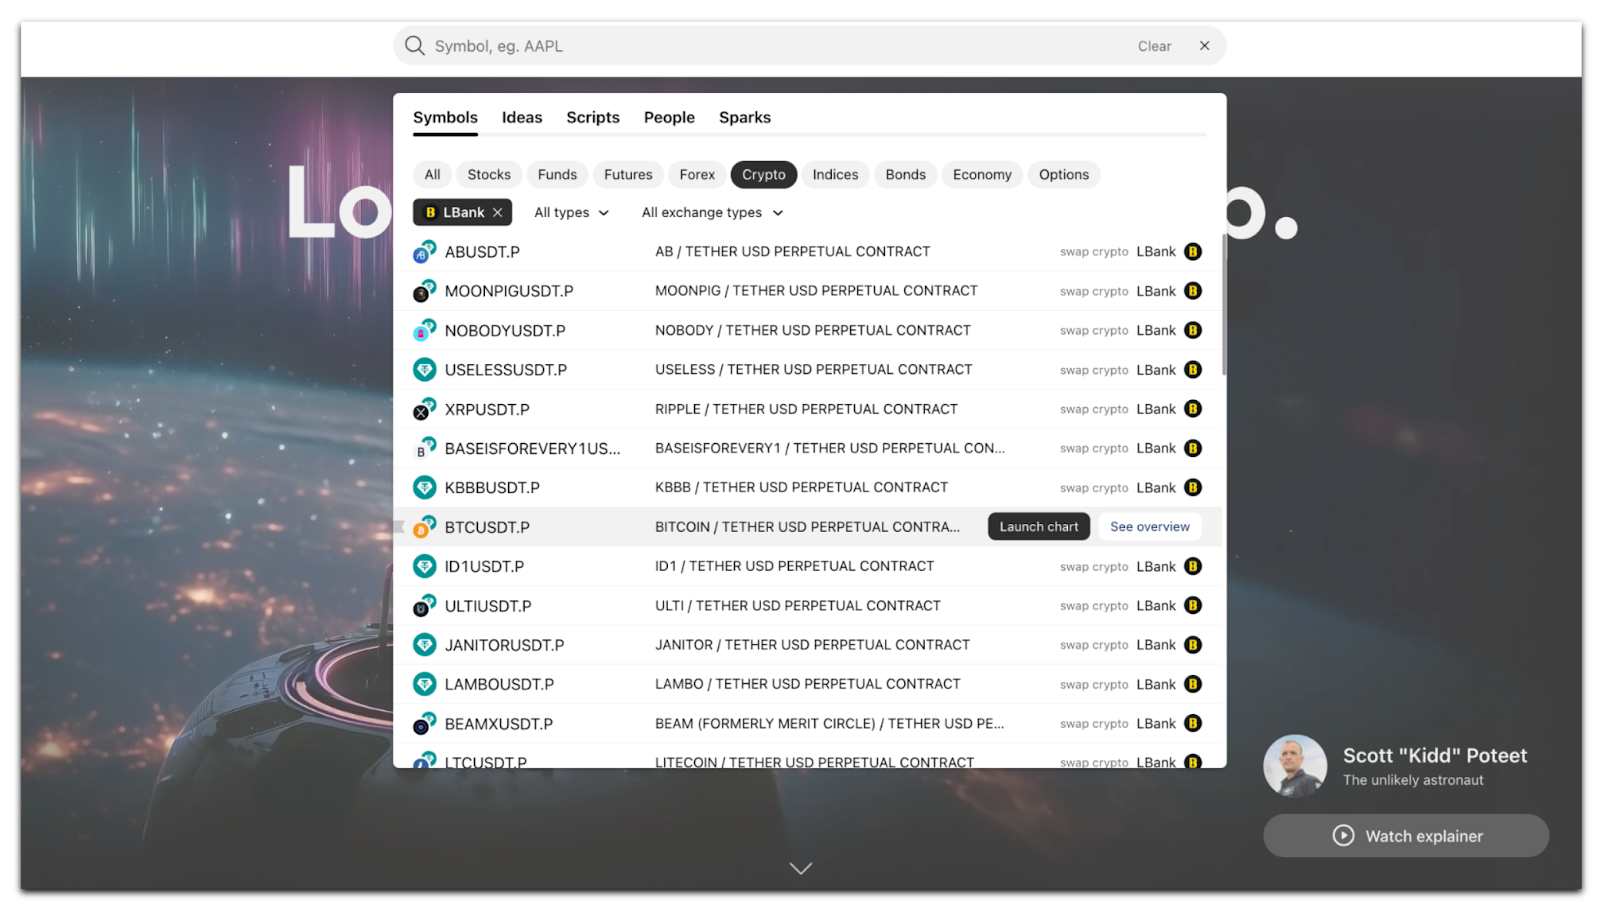
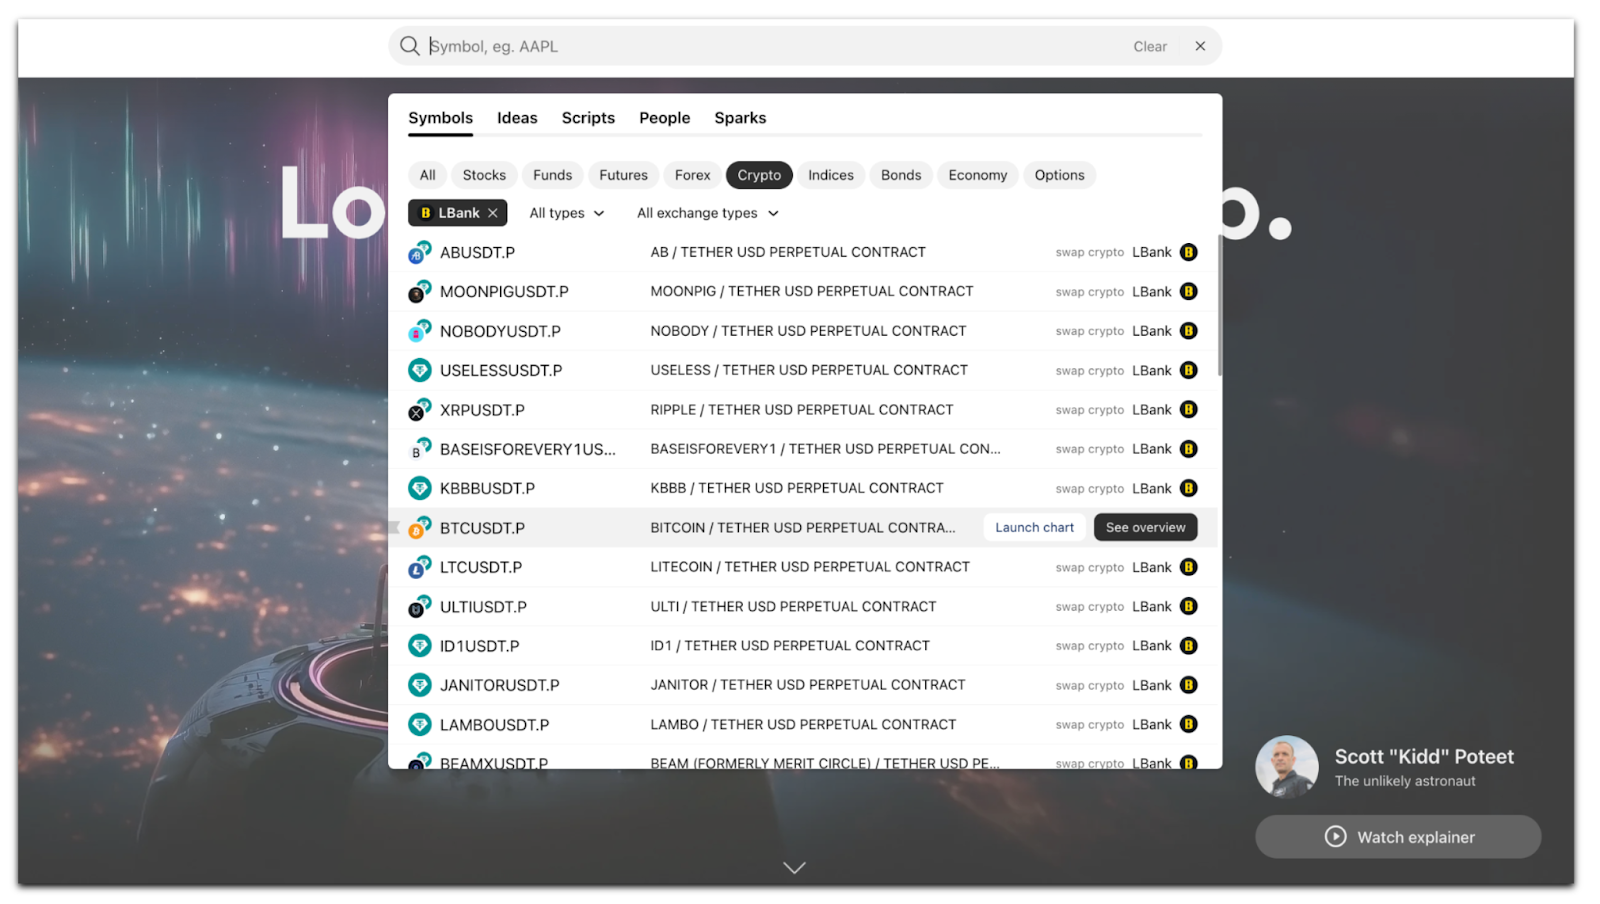
- Example:To find BTC/USDT: Search for [BTC] and select [BTCUSDT.P]; Tap [Launch Chart] for details.
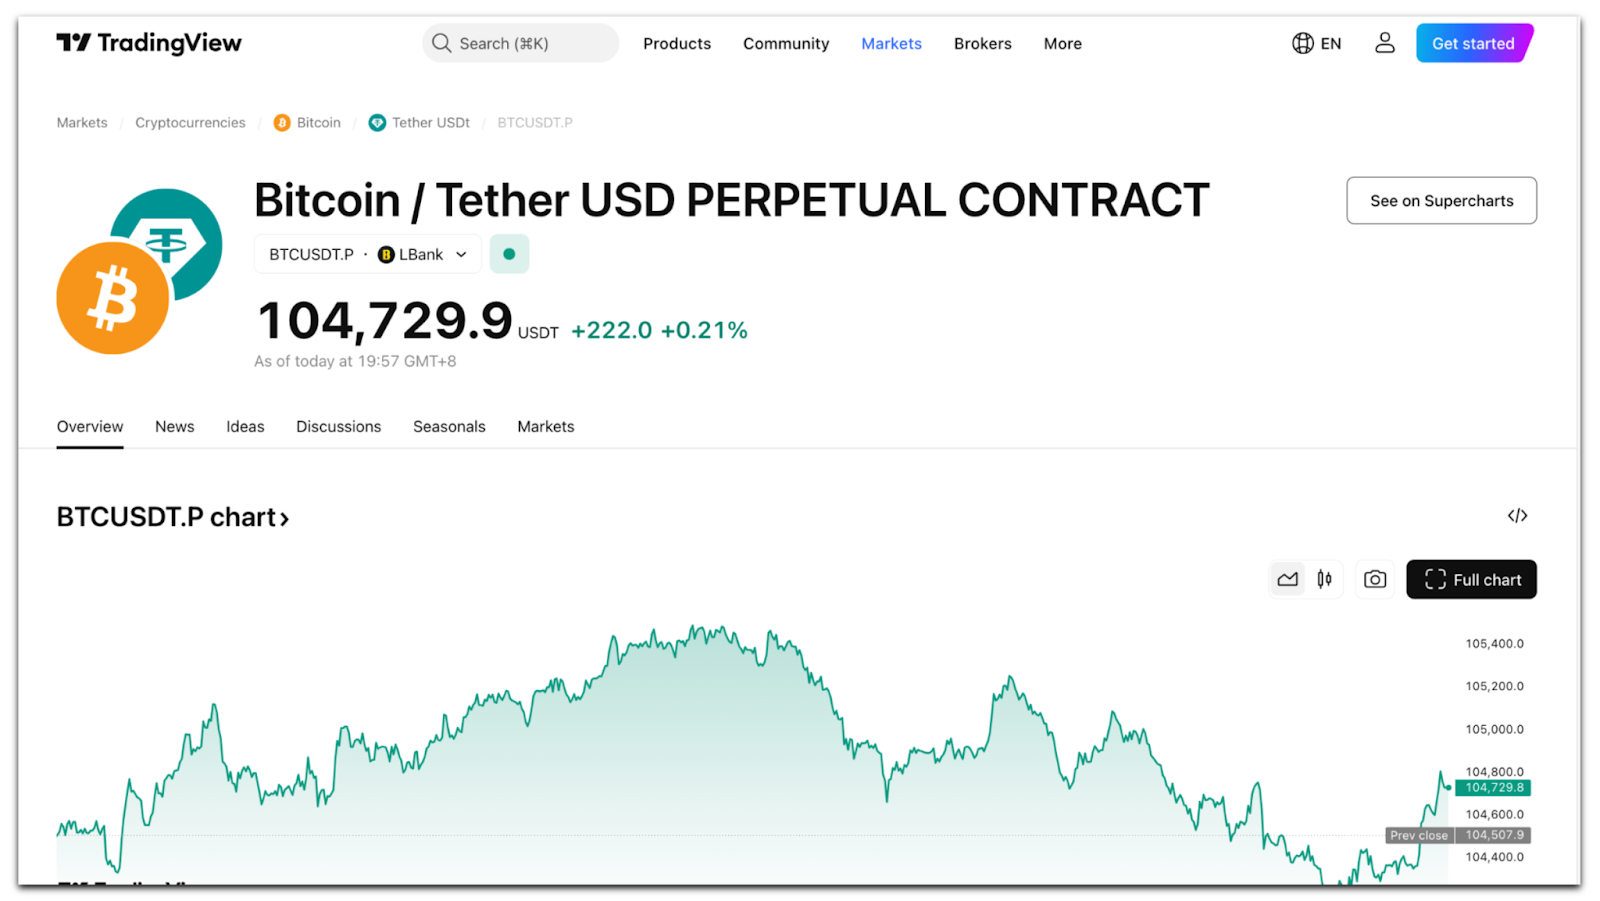
- Tap [See Overview] to access market information.
Note: You can select a unique asset to add to your watchlist and track its performance.
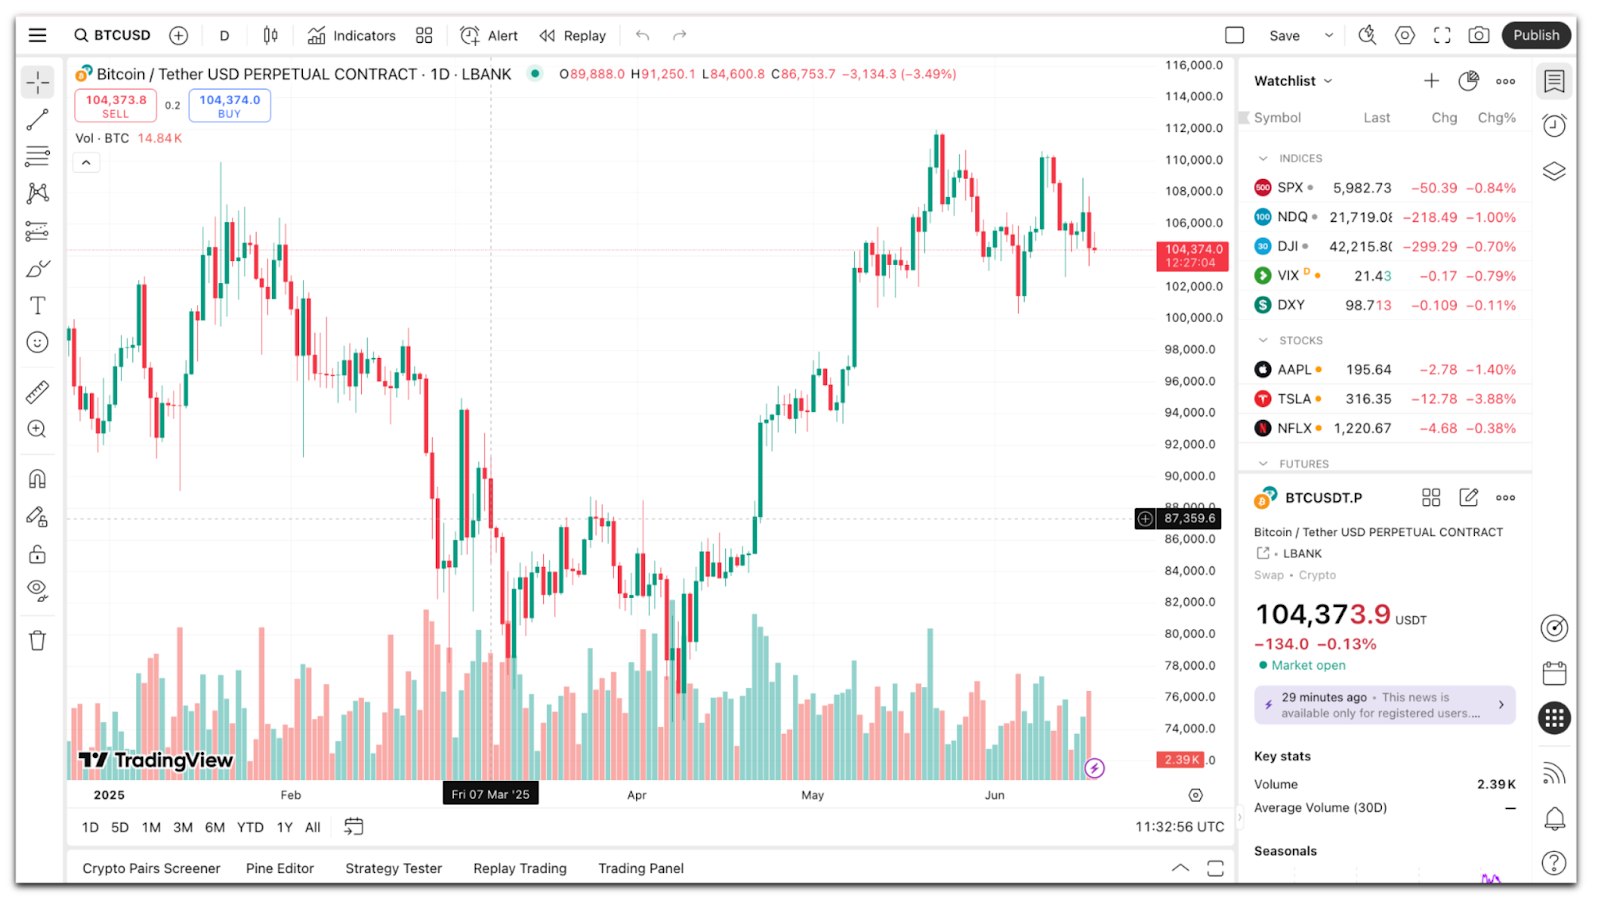
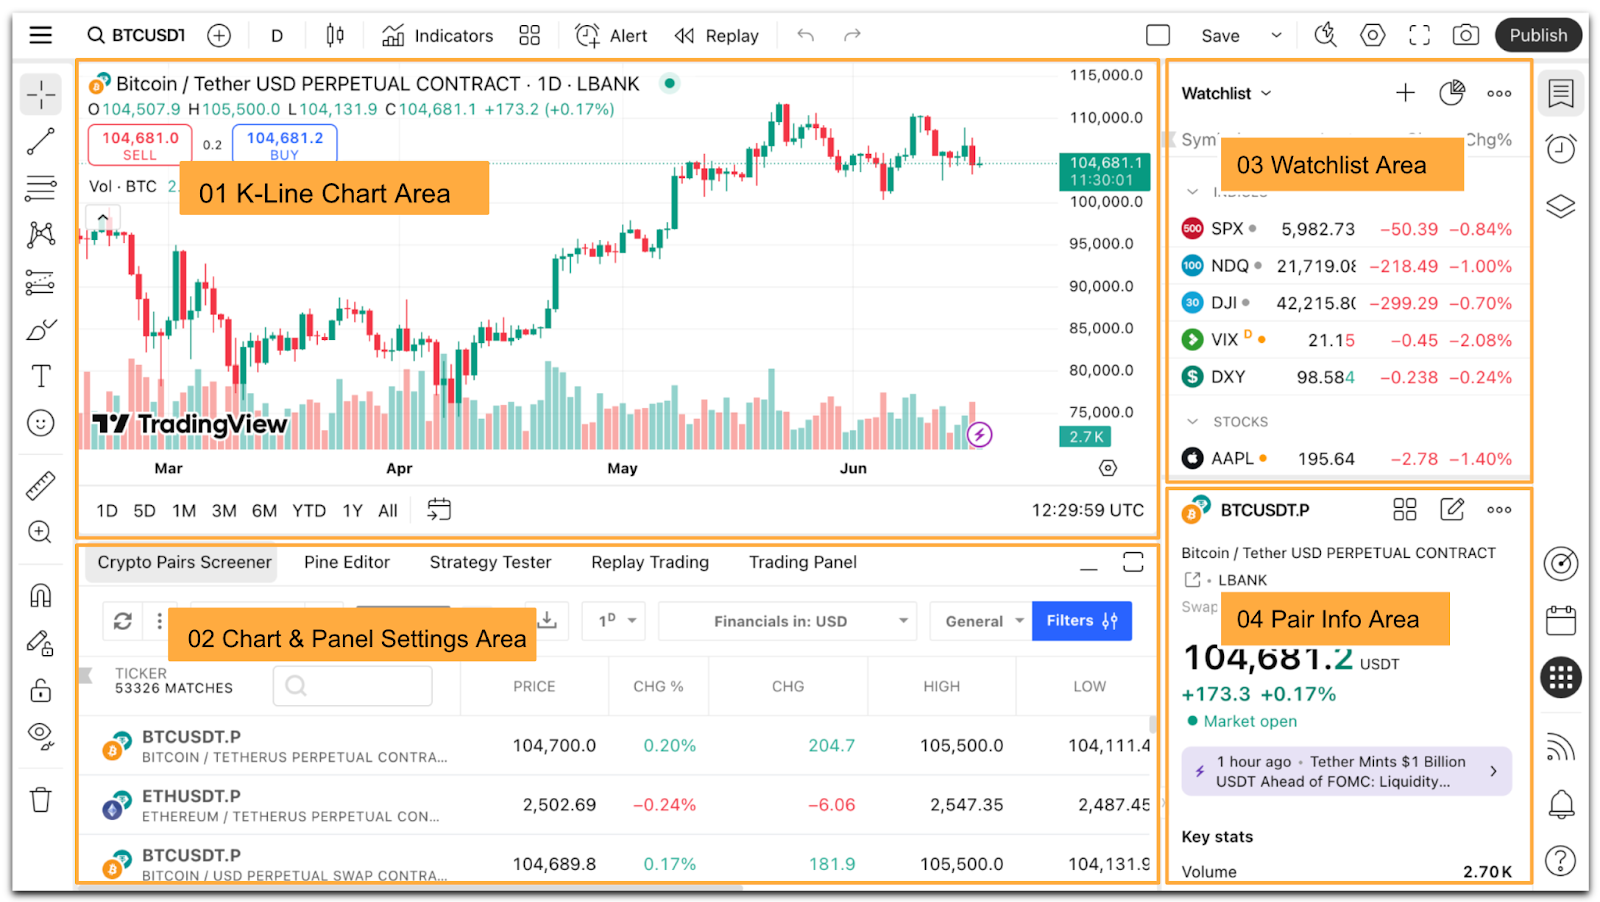
3. TradingView Supercharts Page Overview
| Name | Function Description |
| 01 K-Line Chart Area | Displays the candlestick price chart of the selected trading pair. |
| 02 Chart & Panel Settings Area | Customize the chart analysis panel and switch between different analysis modes. |
| 03 Watchlist Area | Quickly check the prices of your selected markets; click to switch to that chart. |
| 04 Pair Info Area | Shows the latest price and percentage change of the trading pair currently in view. |
App
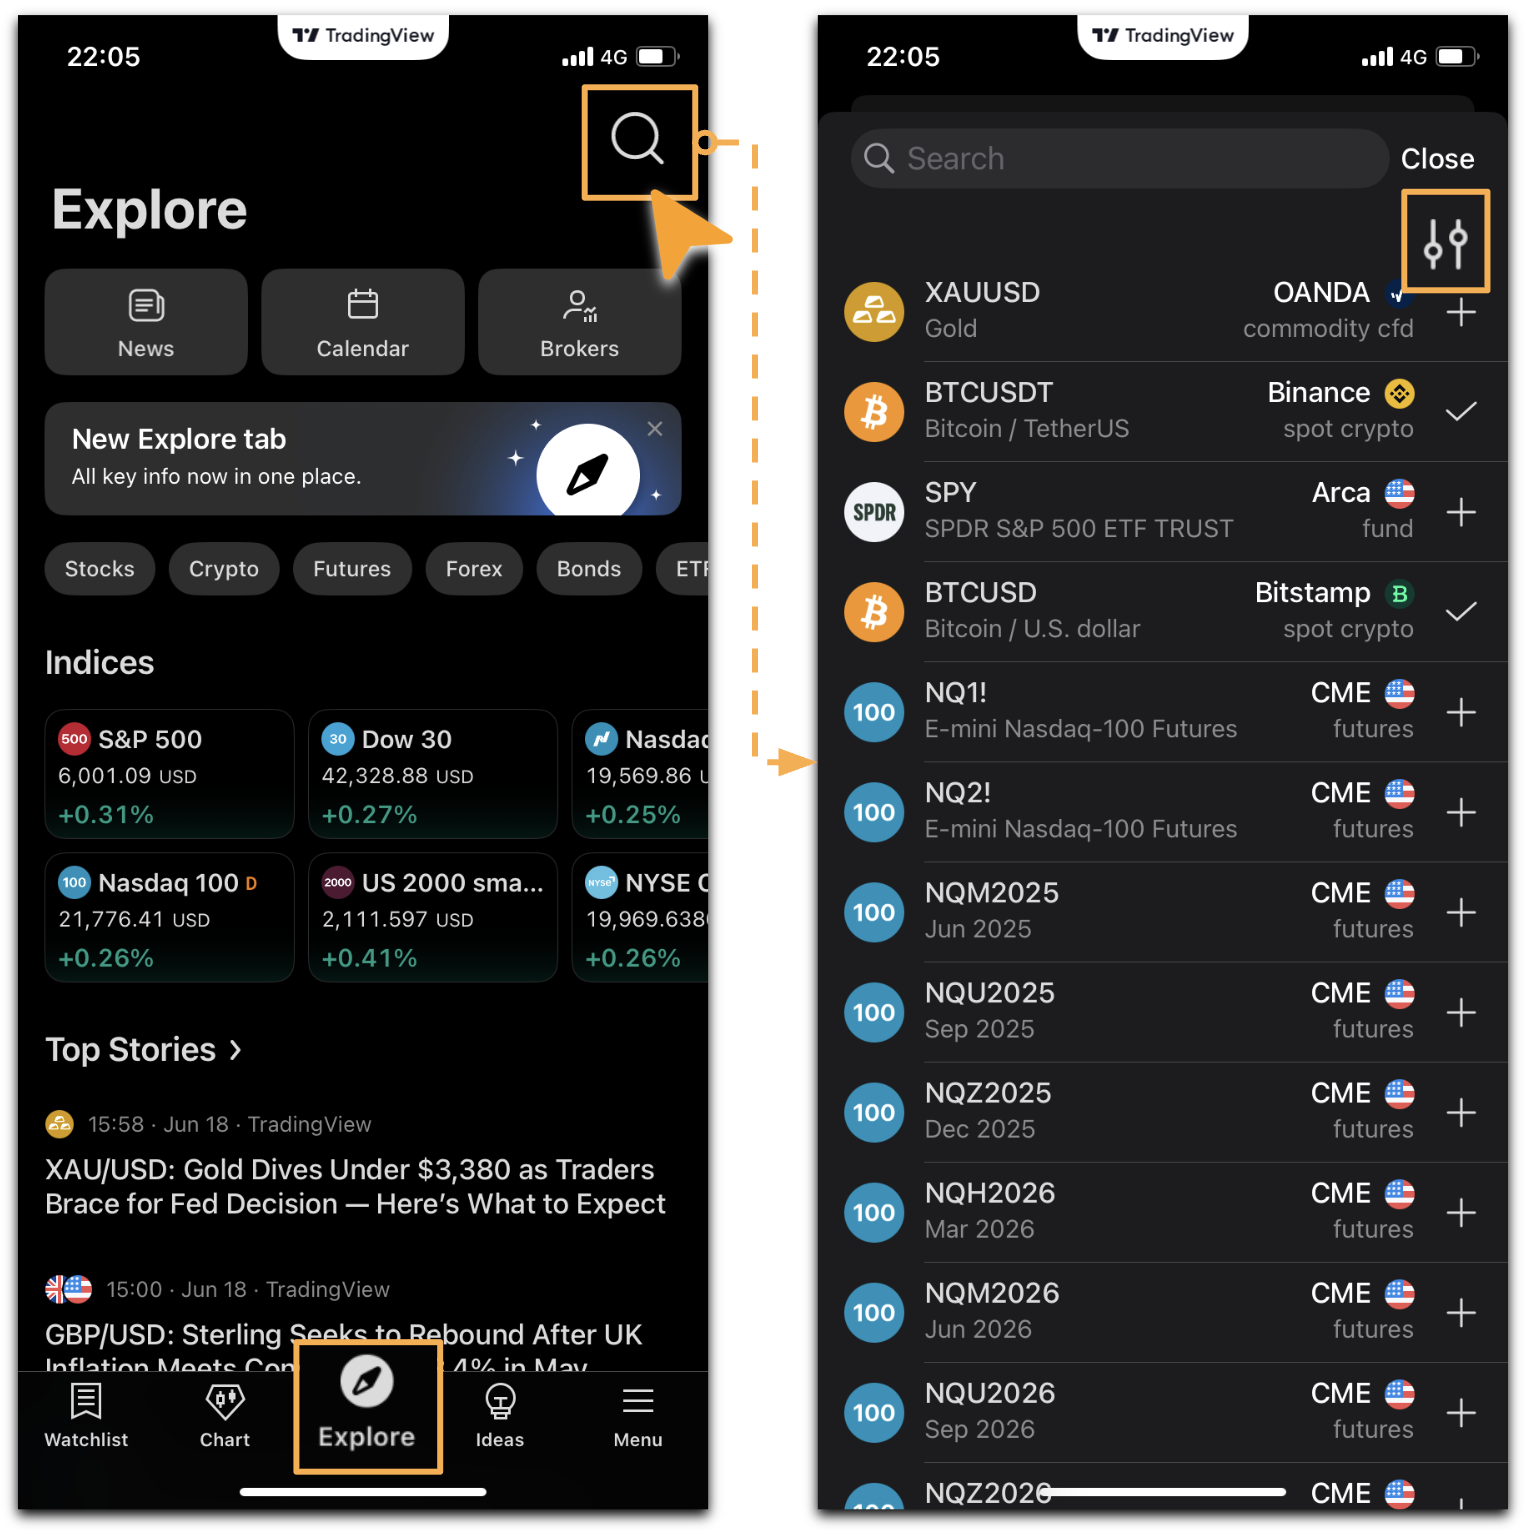
1. Go to TradingView App
Open the TradingView App, select [Explore], tap [search] at the top right. then enter the page, tap the [Filter].
- Note: TradingView App download link 👉https://tw.tradingview.com/mobile/
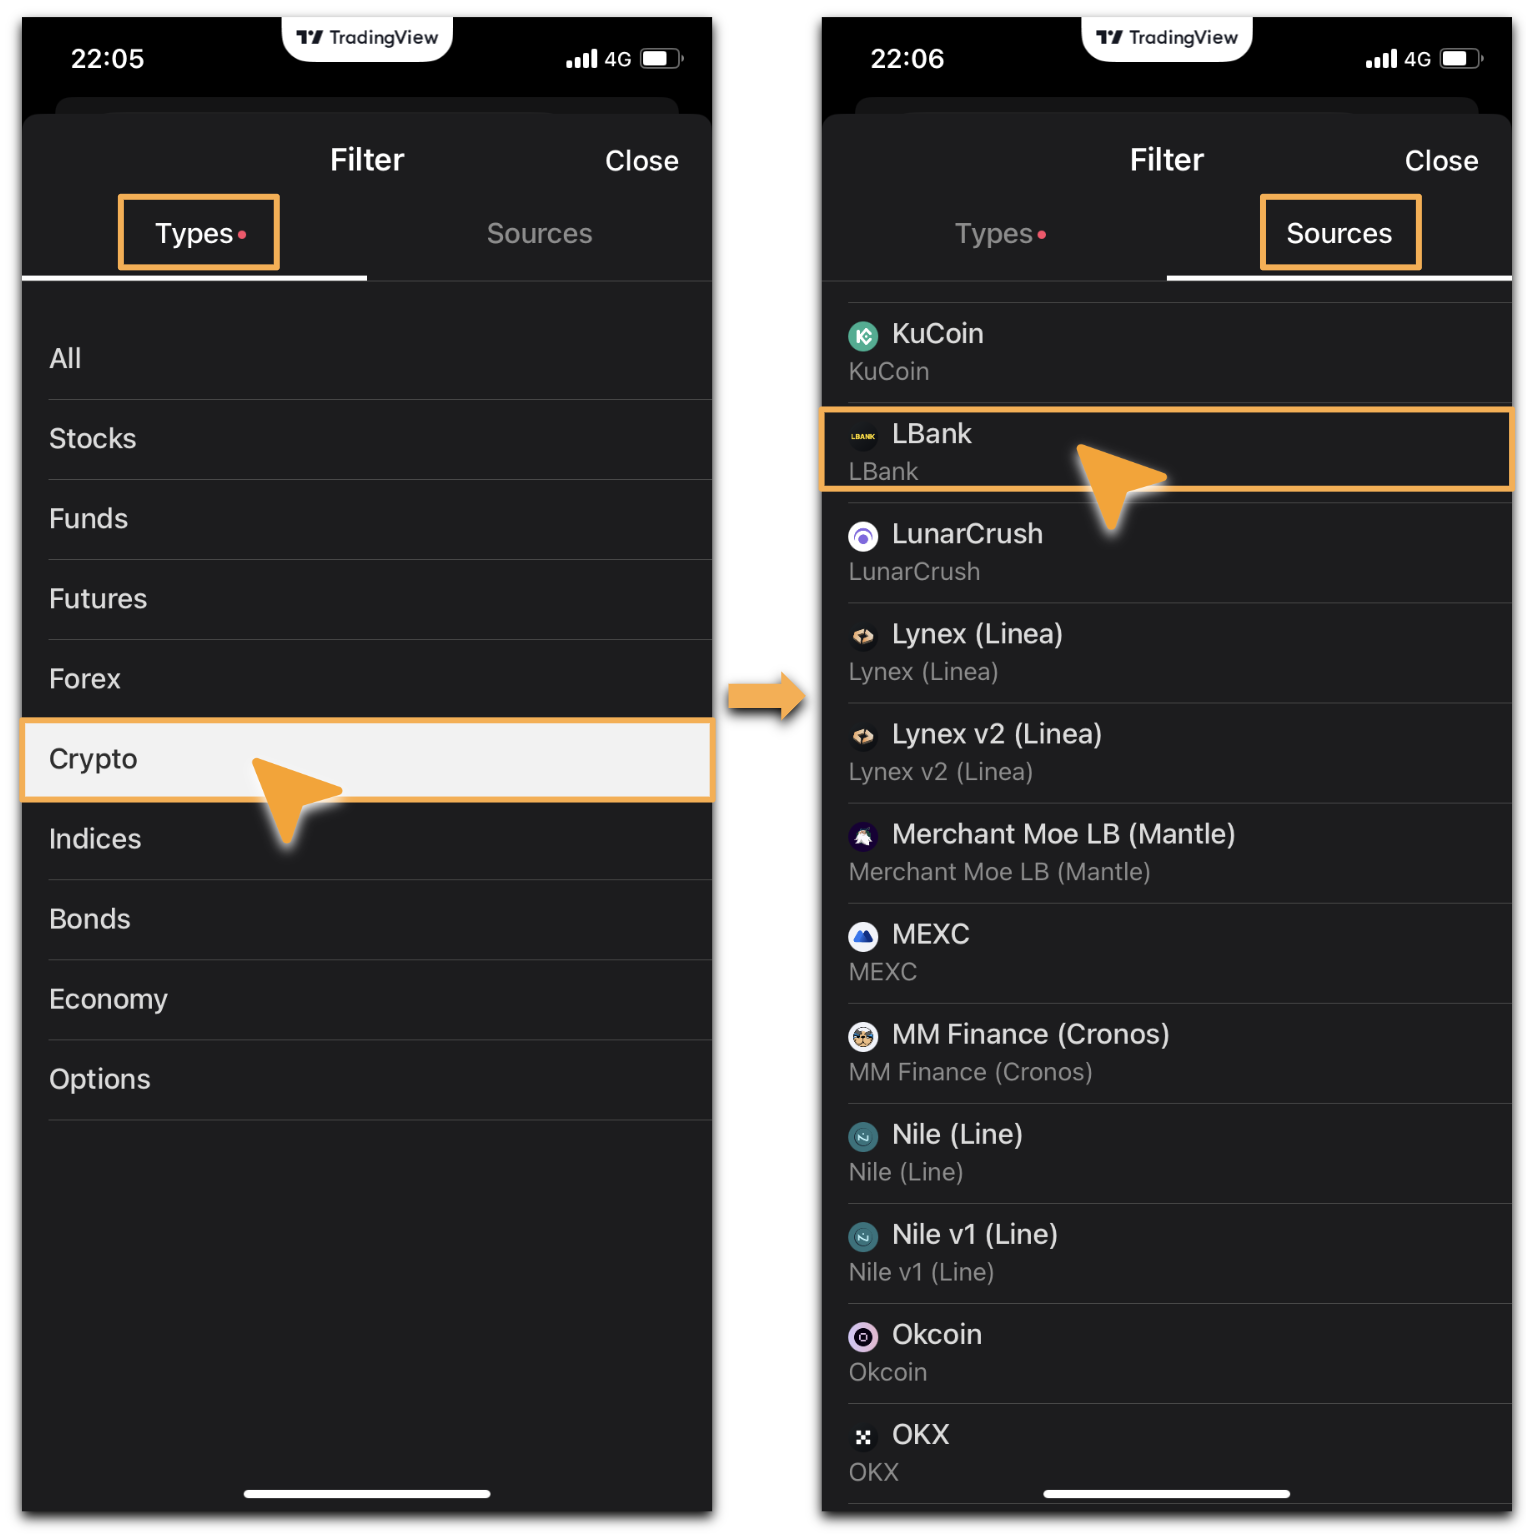
2. Open the Supercharts Interface
1) Select [Types]-[Crypto], and filter [LBank] from [Sources].
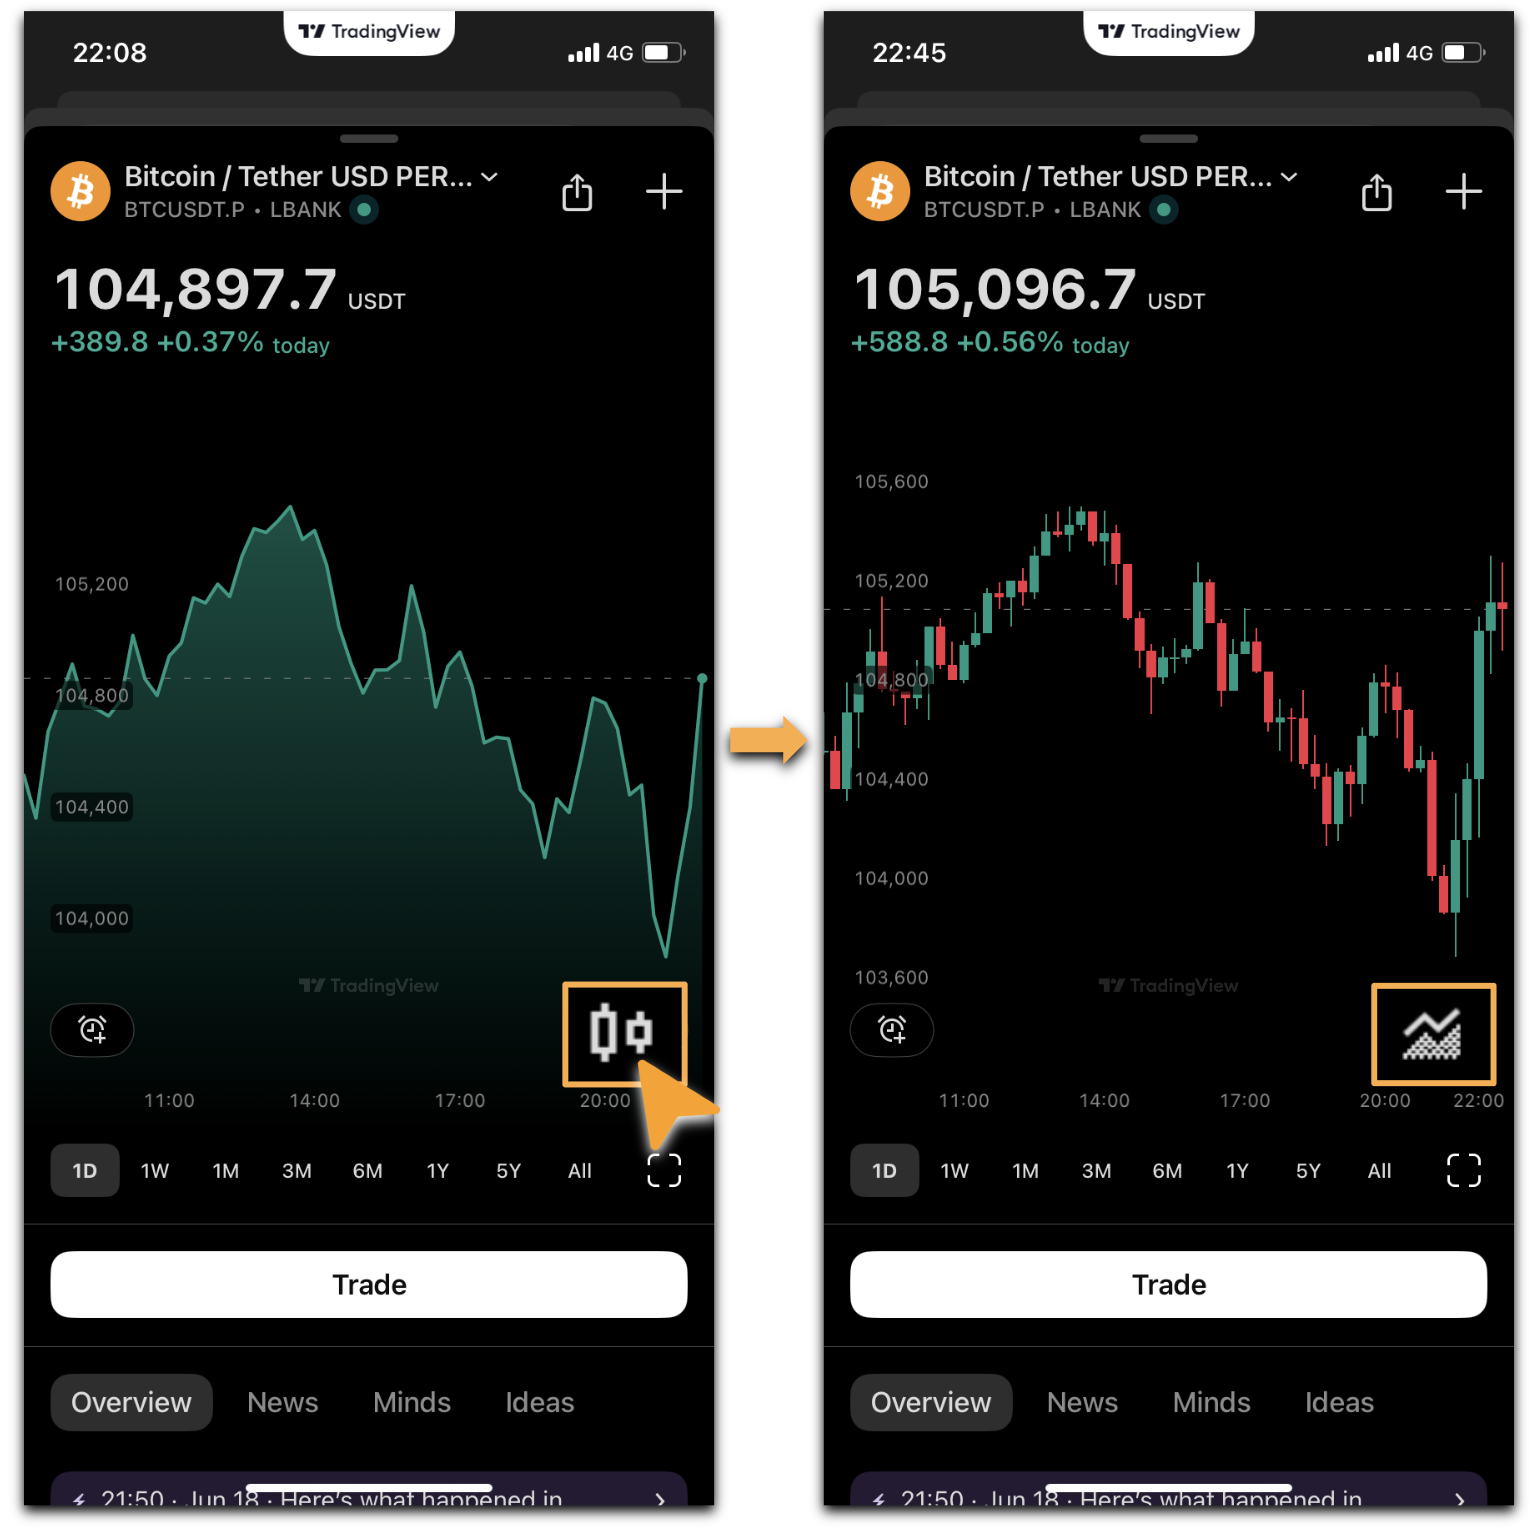
2) You can view all available LBank futures trading pairs on TradingView. For example, to find BTC/USDT: Search for [BTC] and select [BTCUSDT.P].
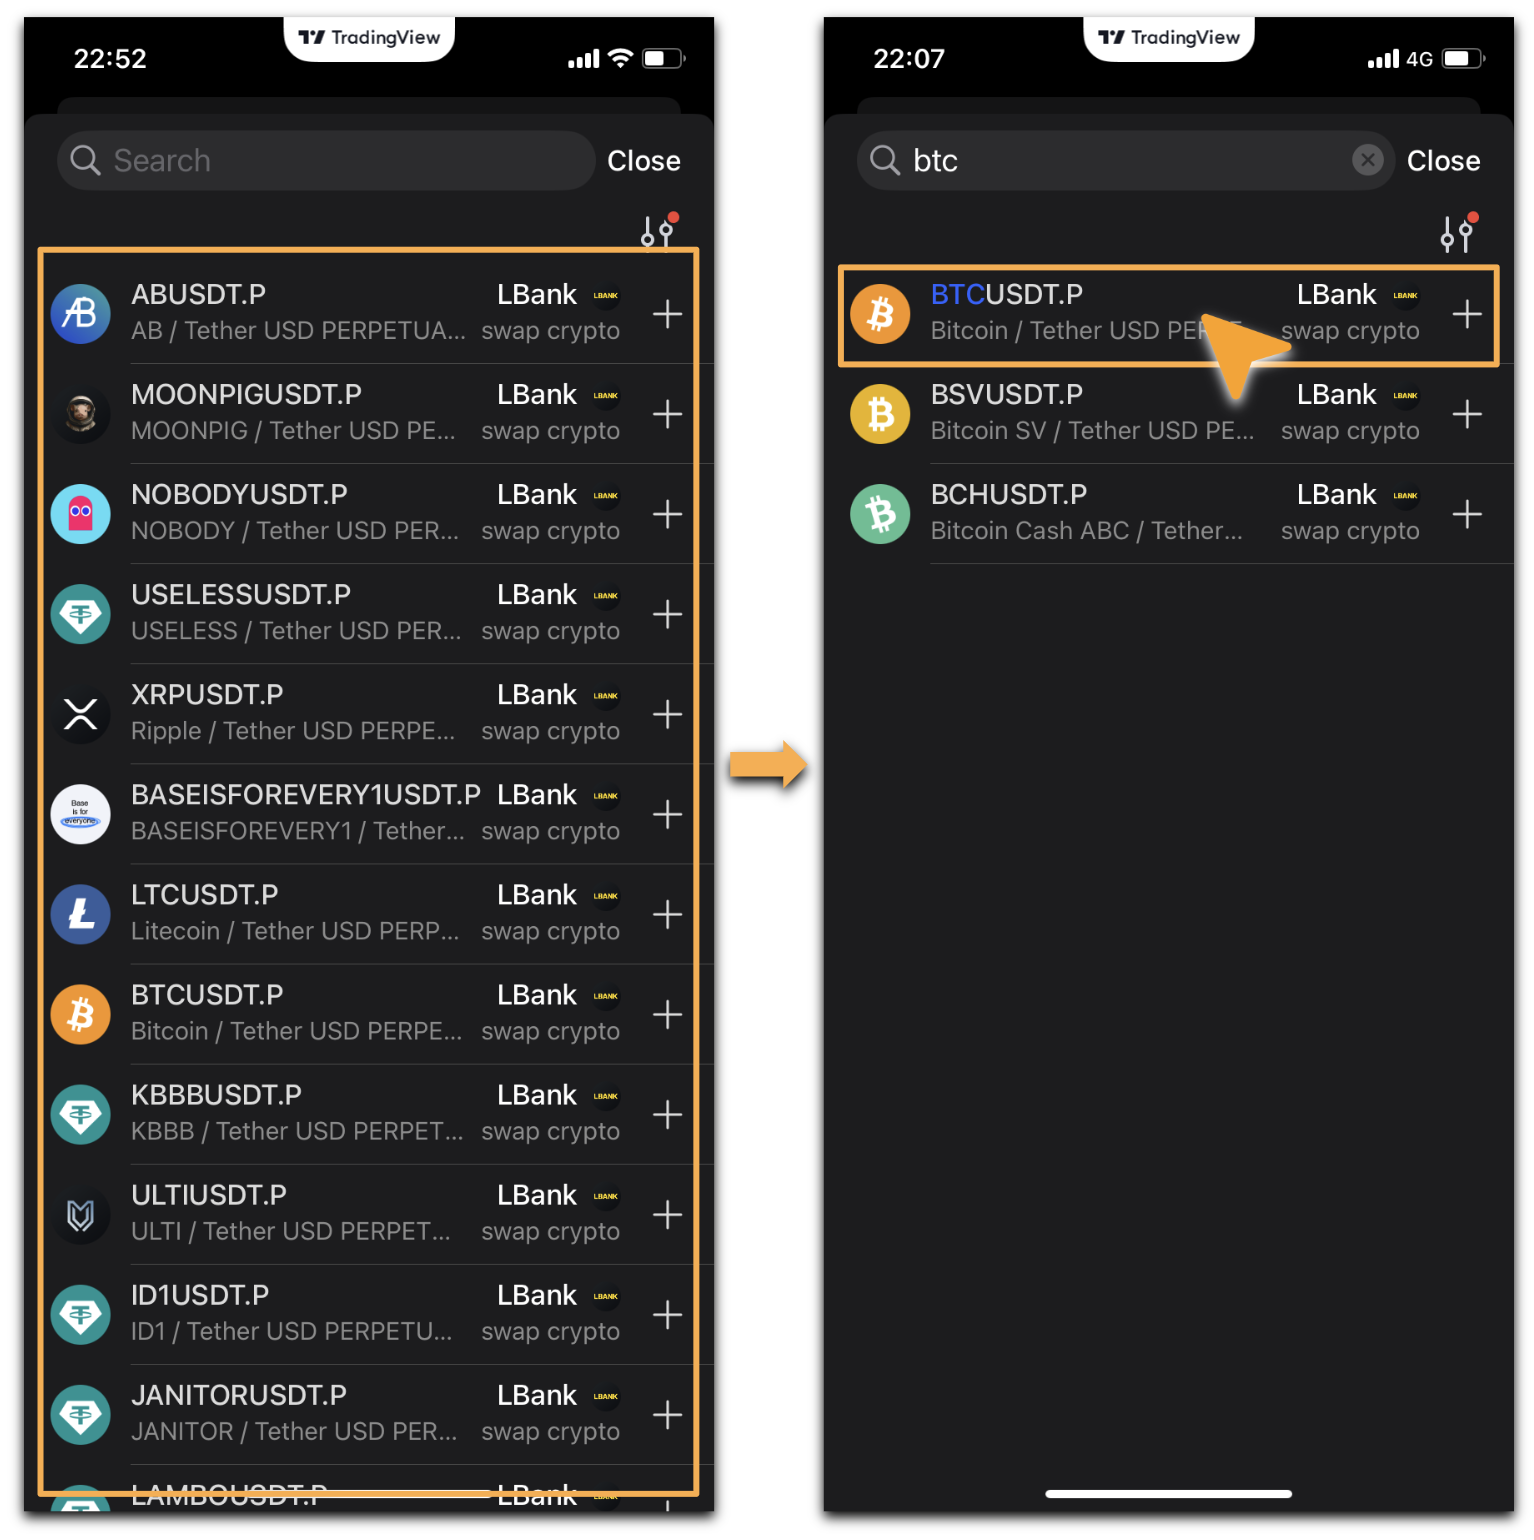
3) Load the BTC/USDT chart and click on the [K-Line Chart] icon to switch to the K-line chart display.
- Note: You can select a unique asset to add to your watchlist and track its performance.
Note:
TradingView is a powerful professional tool for technical analysis, featuring a trading interface that reflects price movements through various chart types and analytical tools. It primarily includes candlestick charts, depth charts, technical indicators, drawing tools, and time intervals.
*In case of translation discrepancies, the English version prevails.