
Beginner's Guide to Candlestick Charts: Essential Skill for Traders
Introduction
The cryptocurrency market, as a high-profile part of the financial field, carries the dreams and expectations of countless investors. However, the high volatility and complexity of this market often deters investors. In this world of challenges and opportunities, understanding and mastering effective trading tools has become crucial. Among them, the K-line chart, as a classic and powerful technical analysis tool, provides investors with an important basis for judging market trends and formulating trading strategies. This article will delve into the basic principles, working mechanism, chart reading methods and application of K-line charts in cryptocurrency trading. By comprehensively understanding and mastering K-line charts, investors will be able to face market challenges with more confidence, seize investment opportunities, and achieve their wealth growth goals.
The definition and importance of K-line charts
-
Definition
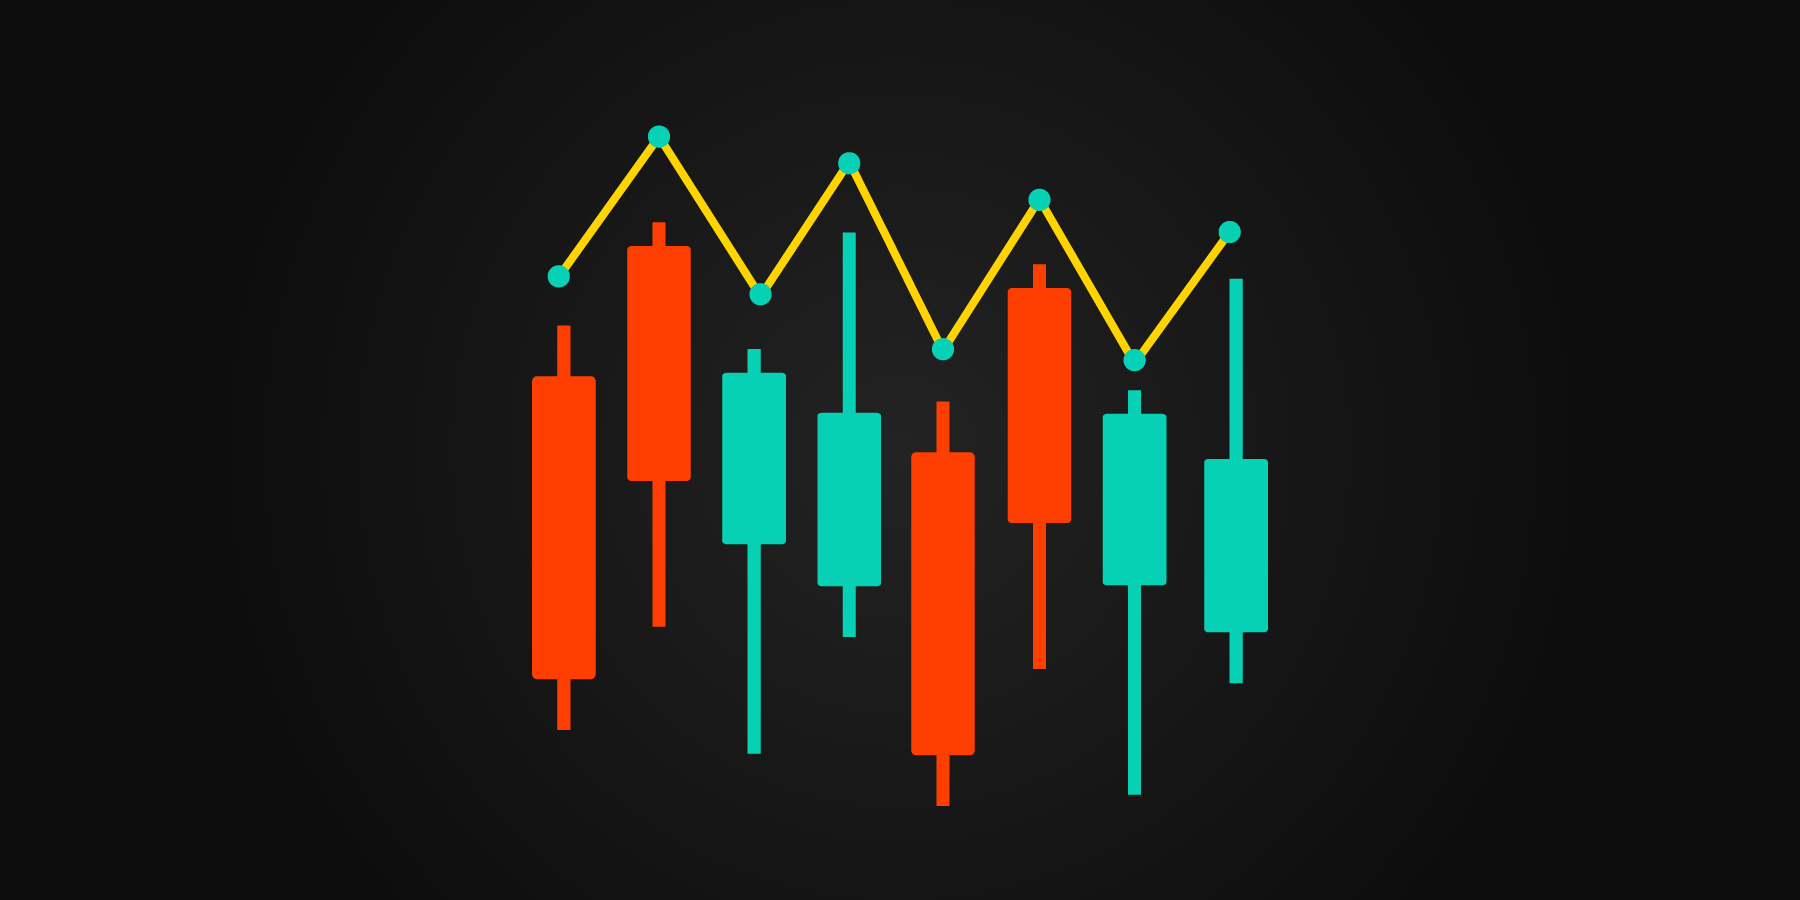
K-line chart, also known as candle chart, is a classic technical analysis tool that originated in Japan and is used to reflect the price fluctuations of financial products (such as stocks, futures, foreign exchange, cryptocurrency, etc.). Its name comes from the shape on the chart. Each K line looks like a candle and consists of two parts: a solid body and a shadow line.
The physical part of the K-line chart represents the price fluctuation between the opening price and the closing price. When the closing price is higher than the opening price, the real body is a positive line, which is usually represented by green; on the contrary, when the closing price is lower than the opening price, the real body is a negative line, which is usually represented by red. The length of the real body reflects the magnitude of the price movement, thereby providing information about the forces of supply and demand in the market.
The shadow line of the K-line chart represents the highest and lowest price of the price within a period of time. The upper shadow extends above the real body, indicating the highest level the price has ever reached, while the lower shadow extends below the real body, indicating the lowest level the price has fallen to. The length of the shadow line reflects the extremes of market volatility and provides important clues to trading pressure and support levels.
-
Importance
By analyzing K-line charts, investors can obtain a large amount of market information, including price trends, comparison of buying and selling power, market sentiment, etc. Therefore, K-line charts have become one of the indispensable tools in the field of technical analysis. For investors, mastering the use of K-line charts can help them make more accurate and well-founded investment decisions and increase the probability of successful transactions.
Basic elements of K-line chart
The K-line chart is a commonly used technical analysis tool in the financial market, which can visually display price fluctuations over a period of time. Understanding the basic elements of candlestick charts is crucial to conducting effective market analysis. The following are the basic elements of K-line charts and their meanings:
1. Upper shadow line:
The upper shadow extends from the top of the real body and represents the price fluctuation between the highest price over a period of time and the real body. The longer the upper shadow line is, the greater the pressure encountered during the price rise, and the market's selling power is relatively strong.
2. Lower shadow:
The lower shadow extends from the bottom of the real body and represents the price fluctuation between the lowest price in a period of time and the real body. The longer the lower shadow line, the stronger the support encountered during the price decline, and the market's buying power is relatively strong.
3. Opening price:
The opening price is the first trading price of a financial product within a period of time, that is, the price at the beginning of trading.
4. Closing price:
The closing price is the last trading price of a financial product within a period of time, that is, the price at the end of the transaction.
5. Highest price:
The highest price represents the highest trading price of a financial product within a period of time.
6. Lowest price:
The lowest price represents the lowest trading price of a financial product within a period of time.
What is the average K-line chart (Heikin-Ashi)?
The average K-line chart (Heikin-Ashi) is an improved K-line chart originating from Japan, and its name translates to "smooth candle chart". Compared with traditional K-line charts, the average K-line chart uses a special smoothing technology designed to reduce the noise of price fluctuations and reflect market trends and trading signals more clearly. In cryptocurrency and other financial markets, the average candlestick chart has become one of the important analytical tools for many investors and traders.
The composition and characteristics of the average K-line chart
The characteristics of the average K-line chart are mainly reflected in the following aspects:
- Smoothing: The average K-line chart eliminates short-term noise in price fluctuations by smoothing price data, making the chart clearer and easier to analyze.
- Weighted calculation: When calculating the opening, closing, highest price, and lowest price of each candle, the average K-line chart uses a weighted calculation method that pays more attention to the impact of recent price trends rather than simply averaging. value.
- Relative trend: The average K-line chart emphasizes the relative trend of prices rather than the absolute price level, which allows investors to judge the overall market trend more clearly.
- Trading signals: The average K-line chart can also generate various trading signals, such as trend turning, buying and selling signals, etc. However, compared with the traditional K-line chart, the signals provided by the average K-line chart are more stable and reliable.
Calculation method of average K-line chart
The calculation method of the average K-line chart is relatively complex, but its core idea is to generate a new candle chart pattern by smoothing the opening, closing, highest price, and lowest price. Specifically, the calculation process of the average K-line chart is as follows:
- Calculate the average price: First, calculate the average price for each time period, that is (opening price + closing price + highest price + lowest price) / 4.
- Calculate the average real body: Based on the calculated average price, determine the average real body size of each candle, which is the price difference between the average opening price and the average closing price.
- Determine the range of the shadow line: The range of the shadow line is determined by the average highest price and the average lowest price.
- Draw the candle chart pattern: Based on the calculated average entity and shadow range, draw the average K-line chart pattern to visually display the price trend.
Application of average K-line chart
The average K-line chart has extensive application value in cryptocurrency trading and other financial markets, mainly reflected in the following aspects:
- Trend confirmation: The average K-line chart can more clearly reflect the main trend of the market and help investors confirm whether the current market is rising, falling or sideways.
- Trading signals: The average K-line chart can also generate various trading signals, such as trend turning, buying and selling signals, etc., to help investors formulate effective trading strategies.
- Filter noise: The average K-line chart effectively filters the short-term noise in price fluctuations through smoothing processing, allowing investors to focus more on the long-term trend.
- Risk management: The average K-line chart provides investors with a more reliable market analysis tool, helping them conduct risk management and asset allocation more scientifically.
How to use candlestick charts for cryptocurrency investing?
The high volatility of the cryptocurrency market makes technical analysis one of the important tools for investors, and the K-line chart, as one of the most commonly used technical analysis tools, plays a key role in cryptocurrency investment. Here are the general steps on how to use candlestick charts for cryptocurrency investing:
1. Learn the basic knowledge of the K-line chart:
First, investors should understand the basics of K-line charts, including their origins, basic elements, and different types. This will provide the necessary basis for subsequent analysis.
2. Analyze a single K line:
Investors can judge the balance of long and short forces in the market by observing the entity, shadow line and color of a single K line. For example, if a K line is a positive line and has a long real body, it may mean that the buyer's power is strong and the market may rise; if it is a negative line and the real body is long, it may mean that the seller's power is strong and the market may fall.
3. Learn the K-line combination:
Mastering common K-line combination forms, such as morning star, evening star, etc., can help investors predict the future trend of the market. These combination patterns often appear before prices reverse or continue a trend, providing investors with important trading signals.
4. Analyze based on moving average:
Using moving average indicators, investors can more accurately judge market trends. For example, when the short-term moving average crosses above the long-term moving average, it may indicate that the market is about to enter an uptrend, which may be a buy signal; conversely, if the short-term moving average crosses below the long-term moving average, it may be a sell signal.
5. Comprehensive use of other technical indicators:
In addition to K-line charts and moving averages, investors can also combine other technical indicators such as trading volume, MACD (Moving Average Convergence and Divergence Index), RSI (Relative Strength Index), etc. to improve the accuracy of analysis. These indicators can help investors confirm trading signals and filter out false signals.
6. Practical operations:
Finally, investors need to continuously carry out practical operations in the actual investment process, accumulate experience, and improve their analytical capabilities and judgment level. Through practical operations, investors can better understand the operating rules of the market and continuously optimize their trading strategies.
Precautions
In cryptocurrency investing, although candlestick charts are a powerful technical analysis tool, investors should keep the following considerations in mind:
1. K-line charts are not everything:
Although K-line charts can provide useful market analysis information, they are not everything. Investors should realize that the K-line chart is only part of the market analysis and needs to be combined with other factors, such as fundamental analysis and news, to make a comprehensive judgment. Fundamental analysis involves assessing the potential value and future development prospects of cryptocurrency, while news involves various news, events, and announcements in the market.
2. Stop loss and take profit:
When investing, it is very important to set reasonable stop loss and take profit points. Stop loss can help investors limit losses in a timely manner and prevent further losses; stop profit can help investors lock in profits and avoid loss of profits due to greed. By setting stop-loss and take-profit points, investors can better control risks and protect their funds.
3. Stay objective and calm:
The investment market is full of uncertainty and volatility, so investors should remain objective and calm when facing market fluctuations. Emotional decision-making often leads to investment mistakes, so investors should follow their own investment strategies and not be affected by market sentiment. Investors should analyze the fluctuations on the K-line chart rationally instead of blindly following the trend or panicking out.
4. Continuous learning:
The cryptocurrency market is changing rapidly, and investors should continue to learn new knowledge and improve their investment capabilities. This includes understanding market trends, learning technical analysis methods, learning about new cryptocurrency projects, and more. Only by continuously learning and accumulating experience can investors maintain a competitive advantage in a rapidly changing market and make more informed investment decisions.
Conclusion
In the cryptocurrency market, K-line charts serve as an important technical analysis tool, providing investors with an effective way to grasp market dynamics. By learning the basic knowledge of K-line charts, investors can accurately analyze market trends and make wise investment decisions. Not only that, K-line charts can also help investors understand the balance of long and short forces in the market, predict future trends, and conduct more in-depth analysis combined with moving averages and other indicators. However, investment is always accompanied by risks, so you need to exercise caution during operations and set reasonable stop-loss and take-profit points to control risks. In addition, continuous learning is also the key to investment success. The cryptocurrency market changes rapidly, and investors need to continuously accumulate experience and improve their investment capabilities. To sum up, although the K-line chart is a powerful analysis tool, only by considering other factors comprehensively and making prudent decisions can you achieve better returns on investment.
Trends
1.How to Buy Crypto Using PIX (BRL → Crypto)2.Exploring the BTC Network: The Operational Mechanism of the Blockchain World3.Bitcoin Leads Crypto Revival, Up 14% Weekly, Market Regains $1.25T Value4.Derivatives DEX SynFutures raises $22 million5.Optimism will activate the Canyon network upgrade on the testnet6.Mysten Labs has introduced zkSend7.Total cryptocurrency market capitalization returned to above $1.2 trillion8.SEC likely to approve all spot bitcoin ETFs at once, says former BlackRock executive