If you have experience trading crypto futures, you have likely encountered this situation:
You got the market direction right, but your stop loss was swept, or the price bounced immediately after hitting your liquidation price. Does it feel like the market is targeting you specifically?
Don't worry, you aren't cursed; you just accidentally stepped into a market "liquidation point." Learning how to use a Liquidation Map (Liq Map) can save you!
You can practice using the version provided by CoinGlass:
https://www.coinglass.com/pro/futures/LiquidationMap
🔍 What is a Liquidation Map?
A Liquidation Map displays price areas where a relative concentration of pending liquidation positions exists, based on market conditions, leverage distribution, and price volatility models.
When liquidation points are densely clustered, price arrival at these levels can trigger a cascading "spiral" effect. For example, if an upward move hits a zone with massive short liquidations, closing those shorts equals buying long, which further drives the price higher.
Simply put:
A Liquidation Map is not a predictive tool nor does it show exact values, but it tells you where the market is likely to become more volatile or where price action might suddenly accelerate.
🧠 Why do Traders Need a Liquidation Map?
Because liquidations are not typical market buys or sells; they are forced executions. The momentum generated is much stronger than standard trading.
You can use the Liquidation Map to assist in the following scenarios:
1. Breakout Trading
Observe the density of liquidations at key price levels to further confirm the probability of a successful breakout.
2. Reducing the Risk of Stop-Loss Hunting
Set your stop losses "outside" of liquidation zones to avoid being swept by institutional liquidity hunts.
3. Better Profit Taking
High-liquidation zones are often where price momentum slows down, reverses, or moves extremely fast.
4. Large Order Strategies
High-liquidity zones are ideal for entering or exiting large positions as they minimize slippage.
📈 How to Read a Liquidation Map?
X-axis = Price Range
Y-axis = Liquidation Intensity (This is not the exact number of liquidated contracts, but rather the relative density of liquidations within this range)
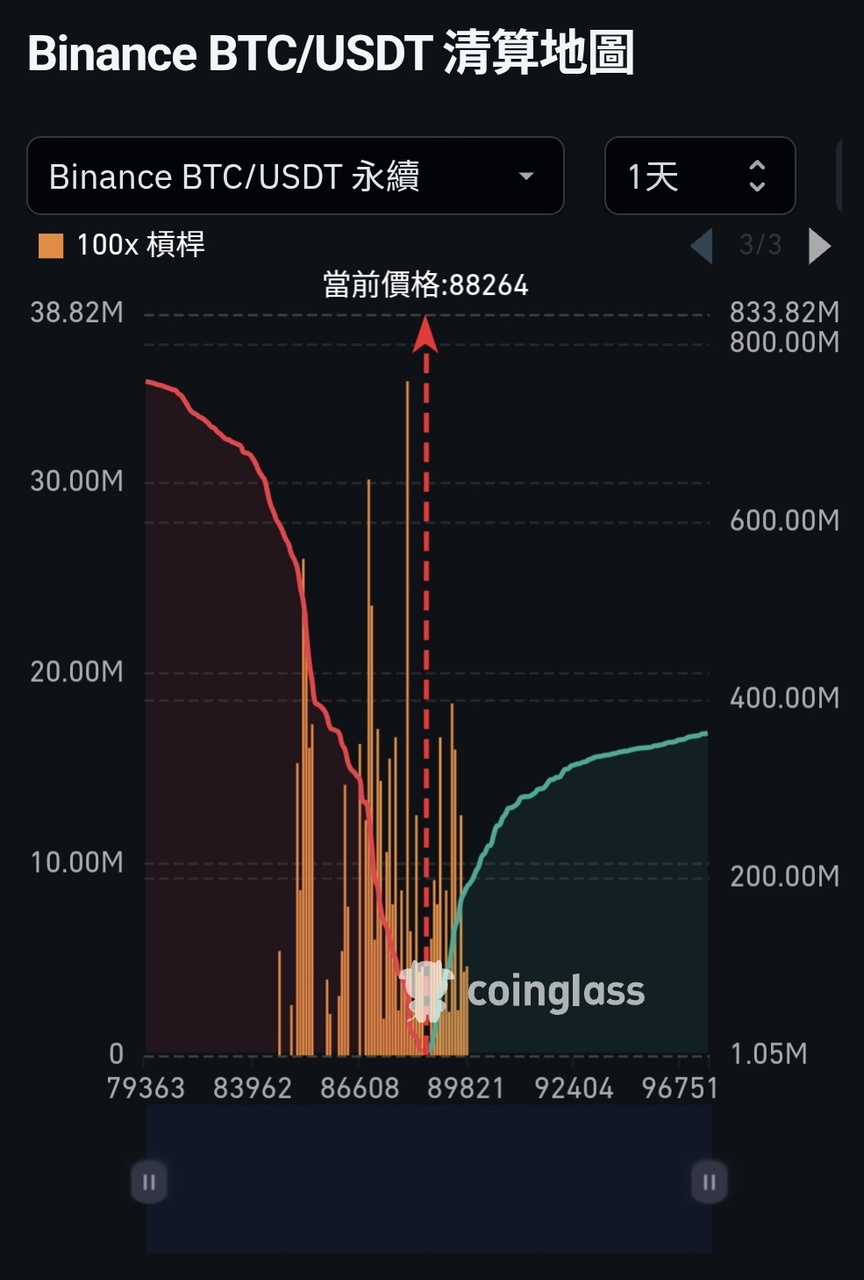
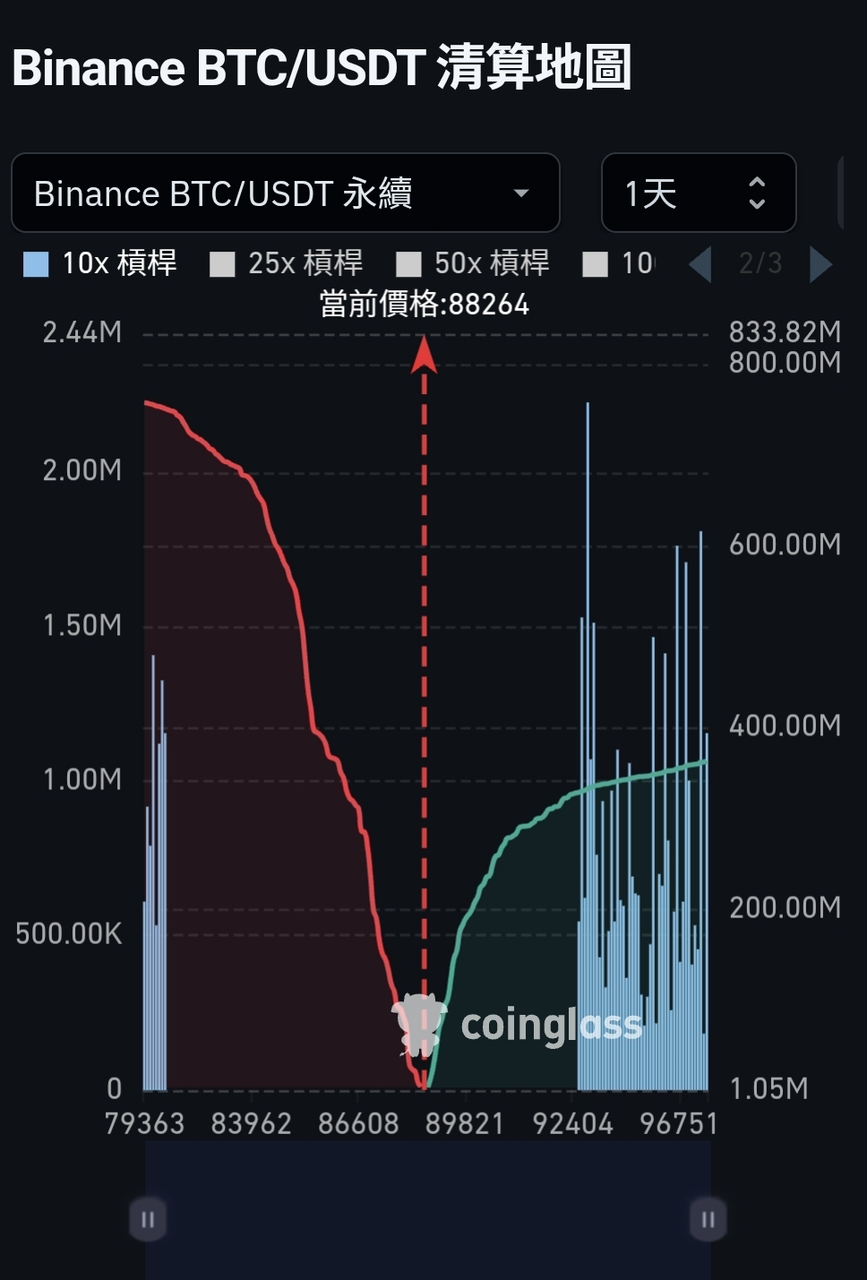
Using BTC as an example:
On the chart, you will see:
Vertical Bars (Yellow/Blue/Red) = Liquidation Clusters
Bars to the right of the current price represent Short Squeezes (Short liquidations)
Bars to the left of the current price represent Long Squeezes (Long liquidations)
Colors are used to make clusters of different leverage ratios clearer. The CoinGlass map includes 10x, 25x, 50x, and 100x leverage.
Higher leverage liquidation ranges are closer to the current price, representing impacts on shorter-term price movements.
If many leveraged positions have very similar liquidation prices, a Liquidation Cluster forms.
When the price touches that area, it leads to:
1. A large volume of forced liquidations being triggered
2. The system executing these as market orders
3. Driving the price faster in the same direction
4. Sweeping even more liquidation prices
5. Triggering a "Liquidation Spiral"
This is also why institutions favor these areas as liquidity entry points, as sweeping a liquidation belt creates a surge in liquidity.
🧪 Practical Exercise (CoinGlass Edition)
Open the Liquidation Map for BTC / ETH / SOL and observe three things:
① Check the nearest liquidation zones
Dense clusters on the right -> Likely to trigger short liquidations in the short term -> Upward spike
Dense clusters on the left -> Possible long liquidation cascade -> Accelerated downward move
② Observe bar density and height
Denser -> More like a fuse/trigger point
Higher -> More violent volatility after liquidations are triggered
③ Combine timeframes and leverage
Low leverage = Smaller immediate impact
High leverage + Short term = Prone to triggering dramatic price action
📍 Final Reminder:
A Liquidation Map is not a leading indicator, nor is it a direct trading signal.
It is more like the 2X scope you find for a sniper rifle in PUBG. It helps you see clearly where the market's weaknesses are, where the acceleration zones are, and where potential market "sniper" positions might be.
However, trading decisions must still rely on your own strategy and data. Always remember the importance of risk management. Good luck with your trades.