ライブチャット
カスタマーサポートチーム
ちょうど今
LBankユーザー様
現在、オンラインカスタマーサービスシステムに接続障害が発生しております。問題解決に向け鋭意取り組んでおりますが、現時点では復旧までの具体的なスケジュールをお伝えすることができません。ご不便をおかけし、誠に申し訳ございません。
サポートが必要な場合は、メールでご連絡ください。できるだけ早く返信いたします。
ご理解とご協力をよろしくお願いいたします。
LBank カスタマーサポートチーム
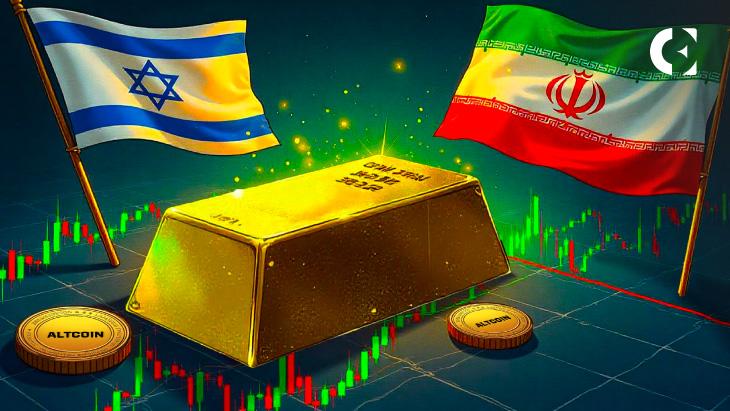
Gold’s breakout to new all-time highs is turning heads across financial markets, including crypto. With yields climbing and oil prices surging amid heightened Middle East tensions, the precious metal has surged past key resistance levels, pushing liquidity beyond $3,440. This move has established a crucial threshold that could shape the direction of risk assets like altcoins.
Cryptocurrency analyst Michael van de Poppe emphasized gold’s growing importance as a market signal, noting that macroeconomic fundamentals remain the dominant force behind current financial trends.
The analyst believes is on the verge of a consolidation phase, a development he sees as potentially easing the pressure on crypto markets caused by the recent safe-haven demand for gold.
The analyst sees two key scenarios that will dictate market action in future sessions. A breakdown below $3,400 would propel gold into a lower timeframe bear trend. This may be indicative of a reduction in uncertainty and allowing risk-on markets to recover. This would be good news for altcoin markets that have languished under current flight-to-safety dynamics.
Conversely, further advances to new all-time highs would distress altcoin markets more as investors go into defensive positions. However, van de Poppe continues to note that such a situation would require patience on the part of holders as markets move towards a possible turning point in which risk appetite would shift.
The chart image illustrates gold’s current price with obvious resistance and support levels marked. Volume patterns indicate consistent interest at these levels, while the overall trend structure suggests the metal remains in an upward trend.
Van de Poppe emphasizes the importance of monitoring for bearish divergences and macroeconomic news that could provide early signals of a trend reversal. These technical and fundamental indicators often precede major directional changes in gold prices.
Middle East tensions have contributed to gold’s recent strength, as geopolitical uncertainty drives demand for safe havens. The analyst suggests that these tensions may have peaked over the weekend, although conditions could deteriorate further if conflicts escalate beyond their current levels.
Oil prices continue to rally alongside gold, creating a dual commodity surge that typically pressures risk assets. This combination of rising energy costs and safe-haven flows creates challenging conditions for growth-oriented investments, including cryptocurrencies and technology stocks.
ちょうど今
LBankユーザー様
現在、オンラインカスタマーサービスシステムに接続障害が発生しております。問題解決に向け鋭意取り組んでおりますが、現時点では復旧までの具体的なスケジュールをお伝えすることができません。ご不便をおかけし、誠に申し訳ございません。
サポートが必要な場合は、メールでご連絡ください。できるだけ早く返信いたします。
ご理解とご協力をよろしくお願いいたします。
LBank カスタマーサポートチーム