Okres czasu: 2025-05-14 ~ 2026-05-15
2025-05-14
2026-05-15
USD
Data | Cena otwarcia* | Wyższa cena | Niższa cena | Cena zamknięcia** | Vol |
|---|---|---|---|---|---|
Brak danych | |||||
* Najwcześniejsze dane w zakresie (czas UTC)
** Najnowsze dane w zakresie (czas UTC)
Gdzie można kupić --
Kup przez aplikację LBank
Zakończ rejestrację konta w ciągu kilku minut i kup kryptowalutę za pomocą karty kredytowej lub przelewu bankowego.
Pobierz aplikacjęOdkryj erę legendarnych memecoinów

O historycznych danych cenowych
Śledzenie historii cen pozwala inwestorom w kryptowaluty wygodnie monitorować wyniki swoich inwestycji. Możesz łatwo przeglądać ceny otwarcia, najwyższe i zamknięcia w czasie, a także wolumen obrotu. Dodatkowo, możesz natychmiast sprawdzić dzienną zmianę procentową, aby łatwo zidentyfikować dni o wyższej zmienności.
Według naszych danych historycznych dotyczących cen , jego wartość wzrosła do rekordowego poziomu ponad -- w --. Z drugiej strony, najniższy punkt w trajektorii cenowej (często określany jako „najniższy poziom w historii”) wystąpił w --. Każdy, kto kupił w tym okresie, mógłby obecnie cieszyć się imponującym zyskiem w wysokości $0.
Zgodnie z założeniami całkowita podaż osiągnie --. Obecnie podaż w obiegu wynosi około --.
Wszystkie ceny podane na tej stronie pochodzą od zaufanego dostawcy danych LBank. Analizując swoje inwestycje, zaleca się, aby nie opierać się na jednym źródle danych, ponieważ wartości mogą się różnić między dostawcami.
Nasz zbiór danych historycznych dotyczących cen Bitcoina obejmuje dane 1-minutowe, 1-dniowe, 1-tygodniowe i 1-miesięczne (otwarcie/maksimum/minimum/zamknięcie/wolumen). Zestawy te zostały rygorystycznie przetestowane pod kątem spójności, integralności i dokładności. Zaprojektowano je specjalnie do symulacji handlowych i testów wstecznych, są dostępne do bezpłatnego pobrania i aktualizowane w czasie rzeczywistym.
przykładów danych historycznych
Oto kilka zastosowań danych historycznych w handlu
Analiza techniczna:
Traderzy wykorzystują dane historyczne do analizy trendów i ruchów na rynku . Używają wykresów i innych narzędzi wizualnych, aby identyfikować trendy i decydować, kiedy wejść na rynek lub z niego wyjść. Jednym ze sposobów na zdobycie przewagi na tym dynamicznym rynku jest wizualizacja i analiza historycznych danych rynkowych. Aby to osiągnąć, dane historyczne można przechowywać w GridDB i analizować za pomocą skryptów Pythona z różnymi bibliotekami, takimi jak Matplotlib, Pandas, Numpy i Scipy do wizualizacji danych.
Prognozowanie ceny na podstawie danych historycznych:
Dane historyczne mogą być również wykorzystywane do przewidywania przyszłych trendów rynkowych. Analizując przeszłe zachowania rynkowe, inwestorzy mogą identyfikować powtarzające się wzorce i formułować trafne przewidywania dotyczące kierunku rynku . Korzystając z historycznego zbioru danych banku LBank, inwestorzy mogą uzyskiwać dane minutowe, takie jak ceny otwarcia, najwyższe, najniższe i zamknięcia dla . Dane te mogą następnie posłużyć do definiowania i trenowania modeli prognozowania cen, pomagając użytkownikom w podejmowaniu trafnych decyzji handlowych.
Zarządzanie ryzykiem:
Uzyskując dane historyczne, inwestorzy mogą ocenić ryzyko związane z inwestowaniem w . Mogą również określić zmienność , co pozwala im podejmować trafne decyzje inwestycyjne.
Zarządzanie portfelem:
Dane historyczne są również przydatne w zarządzaniu portfelem. Śledząc inwestycje w długim terminie, inwestorzy mogą identyfikować aktywa o niskiej rentowności i dostosowywać portfele w celu maksymalizacji zysków.
Szkolenie botów handlowych:
Dodatkowo użytkownicy mogą pobrać historyczne dane OHLC (otwarcie, maksimum, minimum, zamknięcie) dotyczące kryptowalut , aby szkolić własne boty handlowe i osiągać znakomite wyniki na rynku. Dzięki tym narzędziom i zasobom traderzy mogą dogłębnie analizować historyczne dane , zdobywać cenne informacje i potencjalnie ulepszać swoje strategie handlowe.
Jak analizować dane z wykresu świecowego
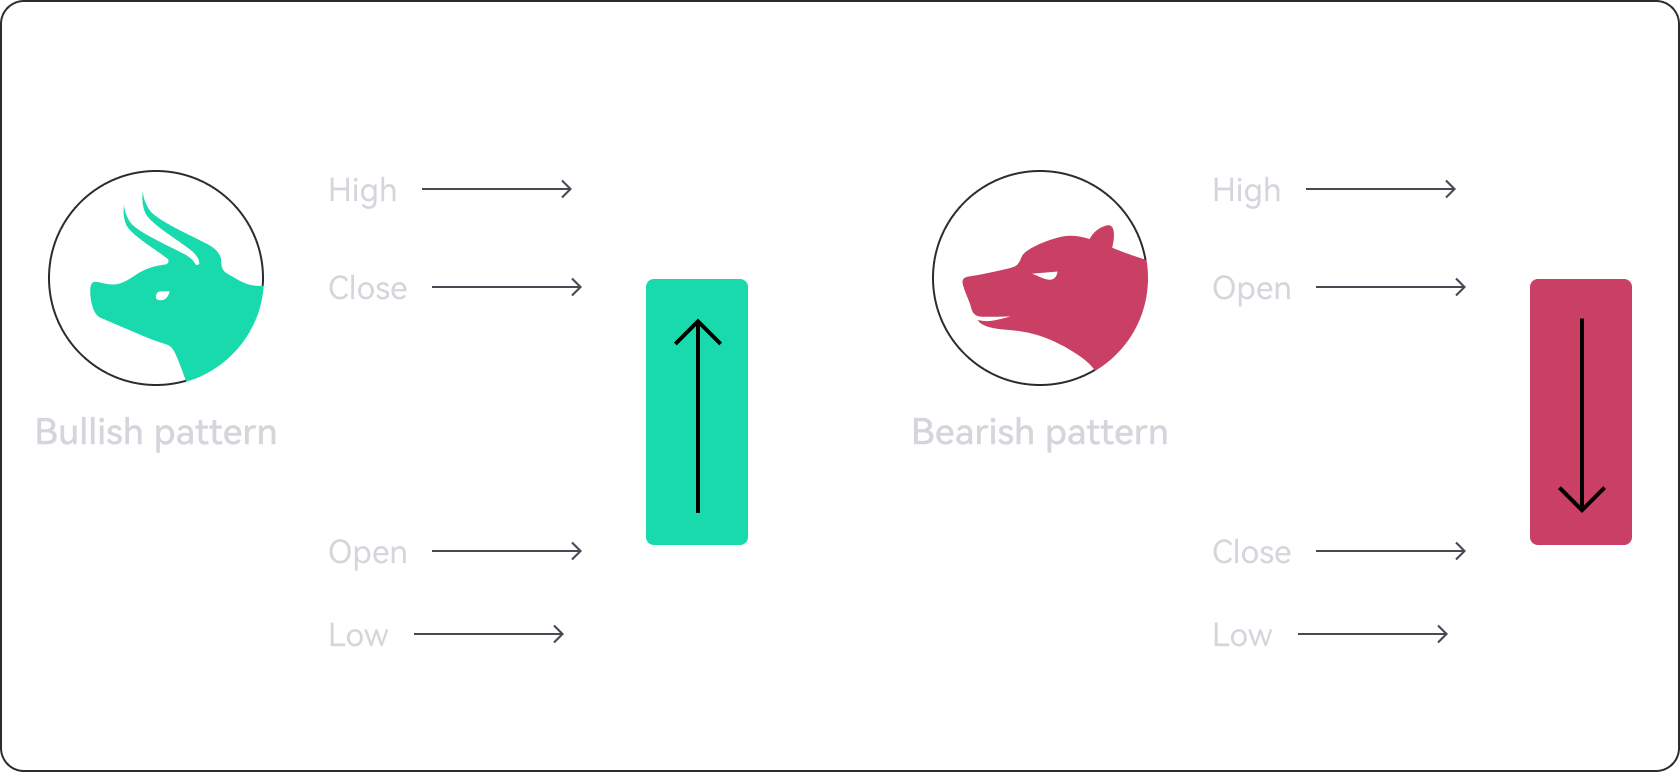
Wykresy świecowe przedstawiają czas na osi poziomej, a dane cenowe na osi pionowej, podobnie jak wykresy liniowe i słupkowe. Świeca może mieć dwa kolory: zielony lub czerwony. Zielona świeca oznacza wzrost ceny w badanym okresie, a czerwona – spadek.
Prosta struktura wykresów świecowych może dostarczyć użytkownikom mnóstwa informacji. Na przykład analiza techniczna może wykorzystywać dane z wykresów świecowych do identyfikacji potencjalnych odwróceń trendu.
Zgodnie z danymi historycznymi , gdy rynek wykazuje trendy spadkowe lub wzrostowe, konserwatywni inwestorzy mogą zdecydować się na produkty z ochroną kapitału, takie jak Elastyczne i Zablokowane, aby uchwycić trend w danym momencie.
Gdy znajduje się w trendzie bocznym, użycie Otwarte kontrakty terminowe i wybranie produktu wzrostowego w celu skorzystania z lekkiego trendu wzrostowego lub wybranie produktu niedźwiedziego w celu skorzystania z lekkiego trendu spadkowego może prowadzić do lepszych wyników.