Reading Market Trends: Mastering Crypto Candlestick Patterns
ソース: LBank時間: 2023-05-05 10:00:00
The Origin and Basic Structure of Candlestick Charts
The visual language of financial markets, known as candlestick charts, originated in Japan's rice trading market during the 18th century. After centuries of refinement and evolution, it has become an essential tool for global investors to analyze the price movements of various assets, particularly in the widely adopted field of cryptocurrencies. Candlestick charts provide a clear and informative picture of historical price dynamics, helping traders understand past movements and attempt to predict future prices.
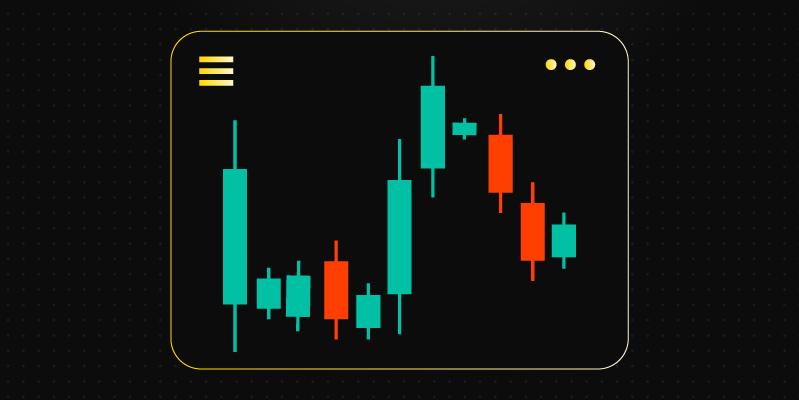
The core building block of a candlestick chart is the individual candlestick, which acts like a micro-narrator, documenting the complete price fluctuation process within a specific time frame (such as one day or one hour). Each candlestick consists of its body and upper/lower shadows. The body represents the price range between the opening and closing prices during that period, with colors revealing the trend: green bodies indicate a closing price higher than the opening price, reflecting upward price movement; red bodies mean a closing price lower than the opening price, suggesting downward price movement.
Upper and lower shadows, on the other hand, display the highest and lowest prices reached within that time frame. They extend beyond the body, resembling antennae that sense extreme market sentiment and potential turning points. Therefore, by interpreting candlestick patterns and their combinations, traders can gain insights into market sentiment, identify critical support and resistance levels, and discover potential buy or sell signals. This enables them to seize favorable trading opportunities amidst the rapidly changing cryptocurrency market.
Decoding Candlestick Patterns and Market Trends
The mystery of candlestick chart patterns lies in the orderly arrangement and combination of multiple candlesticks, weaving a picture that reflects market sentiment, the battle between buyers and sellers, and potential price movements. Each pattern carries unique information, some revealing subtle changes in the balance of power between bulls and bears, whether the bulls are dominant or the bears are pressing; others signal possible price reversals or ongoing consolidation, helping traders anticipate future market trends.
However, understanding candlestick charts is not about viewing them as simple buy or sell signals but rather as a powerful tool for insight into market trends. By combining different technical analysis theories such as Wyckoff Method, Elliott Wave Theory, and Dow Theory, traders can assess the market situation more comprehensively and identify potential investment opportunities when specific patterns emerge.
Moreover, the interpretation of candlestick chart patterns should be combined with other technical indicators. For example, trend lines are used to capture rising or falling market trends, Relative Strength Index (RSI) to determine whether an asset is overbought or oversold, Stochastic RSI to measure changes in price momentum, Ichimoku Cloud to provide a perspective on balancing supply and demand, and Parabolic SAR to mark acceleration points and reversal points.
Crucially, combining candlestick chart patterns with support and resistance levels enhances the understanding of market behavior. Support levels are positions where strong demand stops prices from falling, while resistance levels are areas where increased supply prevents prices from rising. By observing how candlestick chart patterns evolve around these key price levels, traders can better time their buying and selling decisions, enabling them to make more informed and forward-looking choices in cryptocurrency trading.
Detailed Explanation of Bullish Candlestick Patterns
In cryptocurrency trading, bullish candlestick patterns are crucial signals for traders to identify a potential market reversal from bearish to bullish sentiment. The following typical bullish formations have high reference value:
1. Hammer: This is a candlestick pattern that appears at the bottom of a downtrend, characterized by a lower shadow at least twice the length of the body. The hammer indicates that despite heavy selling pressure, buyers have become strong enough to pull prices back up significantly from their lows to near opening levels, suggesting weakening downward momentum and a potential reversal on the horizon.
2. Inverted Hammer: Opposite to the hammer, the long upper shadow of an inverted hammer is located above the body and has a length at least twice that of the body. When this pattern emerges during a downtrend, it means that although prices were once pushed down to a low point by sellers, buyers eventually showed resilience and pushed prices higher, indicating increased upward potential in the market and a possible bullish trend ahead.
3. Three White Soldiers Pattern: This is a three-day K-line combination where each green candle (bullish) opens below or equal to the previous day's high and closes at new highs, with longer bodies and shorter shadows, reflecting strong buying intent and sustained price appreciation momentum. This formation typically suggests that the subsequent trend may continue to follow an upward trajectory.
4. Bullish Engulfing Pattern: This pattern consists of a longer red candle (bearish) followed by a shorter green candle (bullish) that is completely engulfed within the body of the former. The bullish engulfing pattern indicates that after a period of bearish sentiment, bulls begin to regain control, and market sentiment may be shifting from pessimism to optimism, implying that the existing downtrend could end and a new uptrend might emerge.
These candlestick patterns can provide valuable insights into market dynamics, helping traders make more informed decisions when navigating the ever-changing world of cryptocurrencies.
Bearish Candlestick Patterns Decoded
In cryptocurrency trading, accurately identifying and understanding bearish candlestick patterns is crucial for capturing market turns and avoiding
potential risks. Here are several common bearish candlestick combinations:
1. Hanging Man: This is a reversal pattern that is particularly noticeable during the late stages of an uptrend. The hanging man features a small real body and a long lower shadow. Although buyers temporarily push the price back up, the long lower shadow suggests growing selling pressure, indicating that the market may be about to turn bearish.
2. Shooting Star: Similar to the inverted hammer, this pattern appears at the peak of an upward trend. It has a significantly longer upper shadow than its real body and a very short or non-existent lower shadow. The shooting star indicates that despite reaching new highs, the bears ultimately overcome the bulls, resulting in a significant price drop and suggesting a potential turning point.
3. Three Black Crows: A bearish combination formed over three consecutive days, each red candle (bearish) opens within the previous day's real body range and closes below the prior day's low. This pattern demonstrates strong selling pressure and a downward trend, typically signaling a preference for further downside rather than consolidation.
4. Bearish Engulfing Pattern: Comprised of a longer green candle (bullish) followed by a shorter red candle (bearish) that completely engulfs it, this pattern emerges near the end of an uptrend. It signifies weakening buying momentum and a shift in sentiment from optimism to pessimism, suggesting that the existing uptrend may be coming to an end.
5. Dark Cloud Cover: This pattern consists of a green candle followed by a red candle, with the red candle's opening price above the green candle's closing price but its closing price falling below the midpoint of the green candle. Accompanied by high volume, this combination strongly indicates that the market is transitioning from bullish to bearish. Traders often look for confirmation signals in subsequent candles to make more precise decisions.
Analyzing Candlestick Patterns and Their Meanings in Cryptocurrency Trading
In cryptocurrency trading, candlestick charts not only reveal obvious upward and downward trends but also have special patterns that indicate a period of market consolidation or balance. These consolidation patterns can help traders identify ranges where price fluctuations may pause or become unclear.
Three Methods Up and Three Methods Down: These two patterns appear respectively during an uptrend and a downtrend as short-term correction signals. The three methods up consists of a long white (bullish) candle followed by three small black (bearish) candles that do not break below the low of the previous white candle, suggesting a temporary lull in the bullish trend but maintaining the overall direction. Conversely, the three methods down appears during a bearish trend with a long black candle followed by three small white candles that remain below the high of the previous black candle, indicating that the downtrend persists.
Doji and Spinning Tops: A doji is a candlestick pattern where the opening and closing prices are nearly equal (with a slight allowance for minor differences), and its presence suggests a tug-of-war between buyers and sellers with limited price movement. Depending on the length and position of the upper and lower shadows, a doji can be further categorized into:
Long Upper Shadow Doji: This indicates that sellers tried to push prices lower, but the bulls managed to hold their ground, possibly signaling a bearish reversal;
Doji with Equal-Length Shadows: With both shadows being relatively long, this pattern reflects intense competition between buyers and sellers, resulting in a suspended state of the price action over the near term;
Long Lower Shadow Doji: Although there was a significant drop in price, buyers mounted a strong counterattack and pushed the price back close to the opening level, potentially hinting at a potential bullish trend.
However, in the highly volatile cryptocurrency market, exact doji patterns are not commonly seen. Therefore, when the opening and closing prices are close but not identical, a similar-looking formation called a "spinning top" is formed. Similar to a doji, a spinning top represents a balance of buying and selling pressure. However, due to the difference between its opening and closing prices, it provides a more ambiguous indication of the market's next move, requiring additional technical indicators and market context analysis for a comprehensive assessment.
Price Gaps and Their Manifestation in the Cryptocurrency Market
In candlestick chart analysis, a price gap refers to a blank interval in the market price of a financial asset formed between consecutive trading sessions. A price gap is created when there is a significant difference between an asset's closing price at the end of one trading day and its opening price at the start of the next trading day.
However, in the cryptocurrency market, due to its characteristic of continuous 24/7 trading, price gaps are relatively rare. Around-the-clock trading enables buyers and sellers to transact at any time, theoretically allowing the price of cryptocurrencies to continuously reflect changes in market supply and demand, thereby reducing the likelihood of price gaps emerging.
Despite this, under specific circumstances, such as inadequate market liquidity, sudden major news events, or extreme market conditions, price gaps can still occur in the cryptocurrency market. These gaps typically reflect the market's instability or traders' lagged response to information. However, due to the unique nature of the cryptocurrency market, the predictive value of conventional candlestick chart patterns based on price gaps is limited in such markets. When analyzing cryptocurrency candlestick charts, traders need to combine other technical indicators and market dynamics to make an overall judgment of the trend, rather than solely relying on the signal of price gaps.
How to Effectively Utilize Candlestick Charts for Cryptocurrency Trading Decisions
In practical operations, to fully leverage candlestick chart patterns in guiding cryptocurrency trading, the following strategies are crucial:
1. Strong foundation and comprehensive recognition: First and foremost, traders must master a solid understanding of candlestick chart basics and recognize each pattern's market implications. From hammer lines to doji stars, from bullish engulfing to declining three methods, only by thoroughly comprehending the contrasting forces between buyers and sellers behind these formations can one accurately interpret market dynamics.
2. Combining multiple technical indicators: Relying solely on a single candlestick pattern may not be sufficient; thus, traders should integrate candlestick charts with other key analytical tools such as moving averages (MA) to determine trend direction, relative strength index (RSI) to assess overbought or oversold conditions, and MACD (moving average convergence divergence) to reveal momentum changes. The combined use of these indicators provides a more comprehensive and accurate perspective for trading decisions.
3. Analyzing multiple time frames: To capture market sentiment and trend turning points across different time scales, traders need to observe candlestick chart patterns across multiple timeframes. For instance, while monitoring daily charts, they should also check hourly and minute charts to better grasp the interplay between short-term fluctuations and long-term trends.
4. Risk management and trading discipline: Despite offering abundant trading signals, any trading strategy carries risks. Traders must strictly adhere to risk management principles, setting reasonable stop-loss positions to limit potential losses. Additionally, they should avoid blindly frequent trading and enter trades only when opportunities with reasonable risk-reward ratios arise, maintaining a calm, rational mindset and not being swayed by short-term market volatility.
Conclusion
K lines, as a universal language of financial markets transcending time and space, reveal abundant market sentiment and game information behind price fluctuations through their origin, basic structure, and extensive application in the cryptocurrency field. From the real body and shadows of individual candlesticks, traders can capture subtle changes in the balance of buying and selling forces and potential turning points in prices. By interpreting the shapes formed by combinations of multiple candlesticks, we can anticipate future trends and formulate wise investment strategies. When combined with various technical analysis tools and risk management principles, K line charts not only provide valuable decision-making basis for cryptocurrency investors but will also continue to exert their unique insights and forward-looking role with the evolution of the market and technological innovation.
人気辞書
CredentialsWhat Are Soulbound Tokens (SBT)?What is Puffer Finance?Why did the DeFi market (TVL) decline so much in early 2025?How did Tan Shi Min contribute to digital asset innovation?What risks are associated with investing in meme coins?What is the Quantum Financial System (QFS), and which banks use it?QuickSwap: The "Express Lane" for DeFi Exchanges
関連読書
1.Beyond the Hype: A Beginner’s Guide to Bull and Bear Markets2.Next Up to Launch as Memecoin Stays Green Despite Major DOGE ETF Delay3.TOP 5 Play-To-Earn Blockchain Games4.Correlation Between Cryptocurrency and Traditional Markets: Stock, Gold, and Bond5.Grayscale’s Brave New Bid for a Bitcoin ETF Could Blur the Booming Altcoin Market’s Future6.AI Tokens: Top 5 Unique AI Narratives Ranked Based on Market Cap7.A Beginner's Guide to DeFi: Lending, Borrowing, and Earning Yield8.Metaplanet Capital Raising: $1.4 Billion Plan to Strengthen Bitcoin Position as Cryptocurrency Adoption Soars
現物先物
USDTUSDCLTsBTCETHSTABLECOINS
データがありません |