
1. Review of the market the day before yesterday (data from Coinmarketcap/Coinglass)
- The global cryptocurrency market capitalization is $1.14 trillion, an increase of 1.28% in the last day.
- The total cryptocurrency market trading volume in the last 24 hours was $40.55 billion, a decrease of 11.22%. The total volume in DeFi currently stands at $3.37 billion, accounting for 8.31% of the total cryptocurrency market 24-hour trading volume. The current trading volume of all stablecoins is $37.57 billion, accounting for 92.64% of the total 24-hour trading volume of the cryptocurrency market.
- Bitcoin currently accounts for 51.33% of the total market capitalization, with a full-day decline of 0.26%.
- Bitcoin’s greed and fear index today is: 53 (neutral), the same as yesterday.
- The long-short ratio of Bitcoin is 1.1295, an increase of 0.1295 from the previous day.
- The open contract position on the Bitcoin exchange was US$13.233 billion, which was not much different from yesterday, an increase of US$590 million from the previous day.
- Bitcoin option positions across the entire network were US$12.897 billion, an increase of US$52 million from yesterday.
- Bitcoin’s volatility index today is 50.57, which has been at a high level in the past month.
- Ethereum’s volatility index today is 50.96, which is at a high level in the past month.
2. Important news (data from PAnews / Golden Finance / Twitter):
#policy information
- CME "Fed Watch": The probability that the Federal Reserve will keep interest rates unchanged in November is 99.9%.
- The London police established a professional team of 40 people to hunt down cryptocurrency criminals.
- Chief Commissioner of the Malaysian Anti-Corruption Commission: The Anti-Corruption Commission has discovered the use of new media for money laundering such as cryptocurrency.
- Commissioner of Customs and Excise of Hong Kong: The money laundering risks of cryptocurrency exchangers must be addressed and regulatory loopholes must be closed.
#macro information
- U.S. stocks fell last Friday, with the S&P 500 index falling below the key 200-day moving average and recording its largest weekly decline in a month; safe-haven demand drove gains in U.S. bonds and gold.
- This week’s European Central Bank interest rate meeting is coming; the four technology giants Microsoft, Google, Meta and Amazon all released their third-quarter financial reports. The AI giants Microsoft and Google faced off after the US stock market closed on Tuesday.
- Argentina’s presidential election has entered the runoff stage, and Javier Milei, who supports Bitcoin, is temporarily lagging behind.
#Coin circle information
- Bitcoin’s dominance in the crypto market increased to more than 49%, a two-year high.
- Bitcoin options market makers are shorting Gamma, making it easy to rise in the short term but difficult to fall significantly.
- Data: The total locked-up volume of Ethereum Layer 2 is US$10.68 billion, an increase of 2.96% on the 7th.
- Delin Asset Management has been upgraded to Delin Digital Family Office, which will provide investment services in conjunction with blockchain and other technologies.
- Tether Treasury transferred 140 million USDT.
- Visiting professor from the Hong Kong Institute of Financial Management: Hong Kong may need to slow down the development of virtual asset trading.
On the news front, we need to pay attention to the following important news
The U.S. economy is facing a series of important challenges, especially in the U.S. bond market. The U.S. bond market has been experiencing a sell-off since the summer, highlighted by a rise in long-term Treasury yields. On Thursday, the 10-year U.S. Treasury yield was near 5%, hitting its highest level since 2007 and up about 125 basis points from July lows.
The impact of this trend has spread to financial conditions, equivalent to the cumulative effect of three consecutive 25 basis point interest rate hikes since the September Fed meeting, according to the Morgan Stanley Financial Conditions Index (MSDCI). However, despite the tightening of financial conditions, the report believes that the Fed is unlikely to raise interest rates again during the year.
The report notes that this unfolding rise in yields was primarily driven by rising real yields, fully explained by the expansion of term premiums. Market uncertainty and a variety of factors, including fiscal sustainability concerns and higher-than-expected economic growth, are contributing to this trend.
In particular, the direction of the Federal Reserve's policy has become the focus. According to the FOMC's latest dot plot, the Fed has made it clear that they may raise interest rates again, and that higher rates will be maintained for longer. This signal triggered concerns and reactions in the market, further pushing up the yields on long-term Treasury bonds. In addition, the U.S. economy has shown stronger resilience than expected, which increases the possibility of hawkish policies and has a positive effect on offsetting downward inflationary sentiment.
Taken together, although the U.S. economy performed strongly in the third quarter, there are a series of challenges, including uncertainty in the financial environment and a possible slowdown in economic growth. The report pointed out that consumer activity in the third quarter benefited from some one-time factors such as movies and concerts, but these factors may not persist in the fourth quarter, so the U.S. economy may slow down growth.
According to Alex Thorn of Galaxy Research, the spot price of BTC has increased recently, and market makers in the options market tend to short Gamma. But when they short Gamma and the spot price rises, they need to buy back the spot to maintain a balanced risk, which may increase the strength of the short-term rise. According to Amberdata data, market makers shorted Gamma at an initial price of around $28,500. If the BTC price rises to $32,500, these market makers would need to purchase $20 million in BTC for every 1% increase, which could push the price even higher.
In addition, some traders tend to go long Gamma at the price level of 26,750-28,250 US dollars. When they are long Gamma but the spot price falls, they need to buy back the spot to balance the risk. This may limit short-term price declines to some extent. This is a positive sign for the long, as if BTC prices rise modestly, short Gamma’s buyback could lead to a sharp price increase quickly. If prices fall, buybacks from long Gamma may also provide some support, limiting losses in the short term. Simply put, Gamma is an indicator used in the options market to observe the relationship between BTC price and option risk. The Gamma values of different trading strategies may have an important impact on BTC price trends.
The current market rise in BTC and ETH is mainly driven by the expected launch of the Grayscale GBTC to Bitcoin Spot ETF. However, the specific opening time is not yet clear. If the Bitcoin spot ETF is approved in the near future, the price is likely to continue to rise, but the specific increase is difficult to determine. However, if the ETF is not approved, the emotional impact is only one aspect, and we cannot ignore the current macro-level capital shortage problem.
In a high interest rate environment, the disposable income of the American people is gradually decreasing. While the excess savings caused by the pandemic have not yet fully subsided, this could happen in early 2024. The actual situation may be more severe than we imagine. The U.S. auto loan delinquency rate has reached its highest level in 30 years. Cars are not only a means of transportation for Americans, but also a necessity of life. Moreover, the current situation may not have bottomed out yet. The Federal Reserve is likely not to cut interest rates for a long time in mid-2024, which will lead to a reduction in people's disposable income. Although the employment rate is high, it is mainly in the service industry. Traditional industries, manufacturing and retail industries are facing severe challenges, and the future prospects may be even less optimistic.
Under this circumstance, it is still unknown whether a Bitcoin bull market can be started. Already, many people are facing a shortage of funds, not just in the venture capital field. Recent bank financial reports have reflected that more and more people are relying on credit to make ends meet. Therefore, in this case, high prices may add to the selling pressure.
3. Technical indicator analysis (chart data from LBank/Coingecko)
BTC
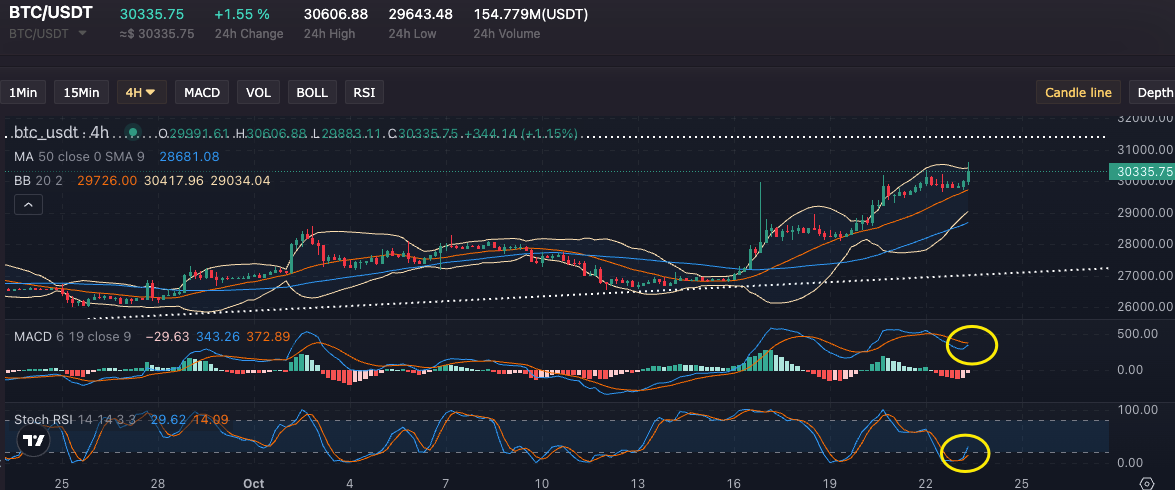
The current price of BTC is US$30,251, with an increase of 1.27% in 24 hours; the 24-hour trading volume is US$12.3 billion, an increase of 5.02% compared to one day ago.
Yesterday, the price of BTC fluctuated within the range of 29,700-30,400 US dollars. This morning, BTC suddenly rose and broke through the recent high, reaching a maximum of 30,650 US dollars before falling slightly.
It can be seen from the daily chart that BTC is trending well and has an obvious upward trend. At this time, the price is moving up along the Bollinger Band track. On the daily line, it is currently the extended wave of the fifth wave. In the short term, it can hit the previous high of $31,500.

According to the 4-hour chart, BTC is moving upward along the upper track of the Bollinger Bands. Currently, MACD and RSI have golden crosses upward, with short-term support at $29,750 and pressure at $30,800-31,300.
Personal opinion, for reference only.
Click to trade : https://www.lbank.com/en-US/trade/btc_usdt/
ETH
The current price of ETH is US$1,679, with an increase of 3.27% in 24 hours; the trading volume in the past 24 hours was US$6.02 billion, an increase of 36.01% from a day ago.
From the daily chart, ETH price stands firm on the 50-day moving average. The current price is on the upper track of the Bollinger Bands. The RSI is slowing down in the overbought zone. The MACD long energy column continues to increase in volume.
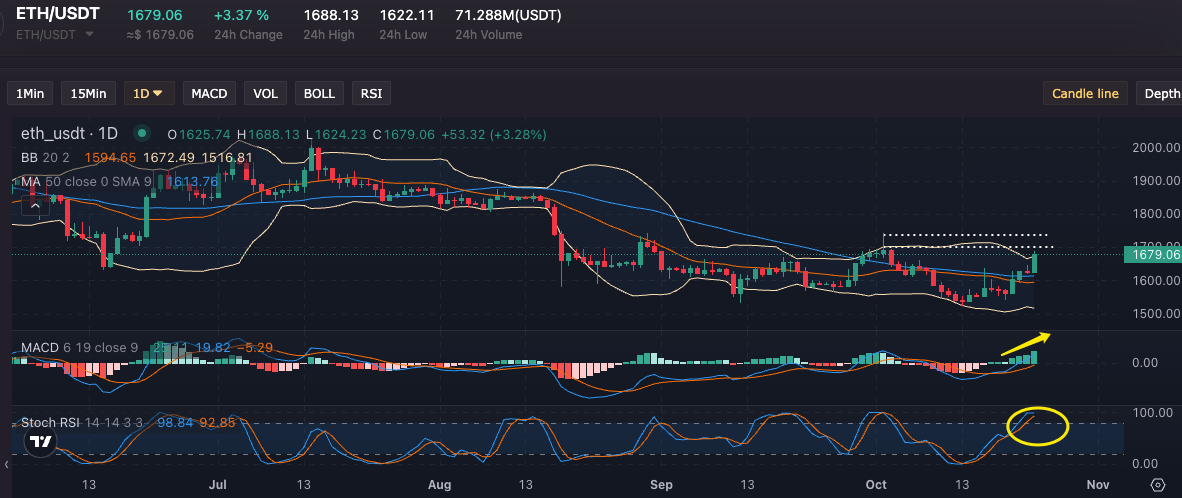
According to the 4-hour chart, ETH has strong support near the middle track of the Bollinger Bands. At this time, MACD continues to move upward with a golden cross, and a golden cross also appears after the RSI pullback. The short-term pressure level is 1710-1750 US dollars, and the support level is 1625 US dollars.

Personal opinion, for reference only.
Click to trade : https://www.lbank.com/en-US/trade/eth_usdt/
PEPE
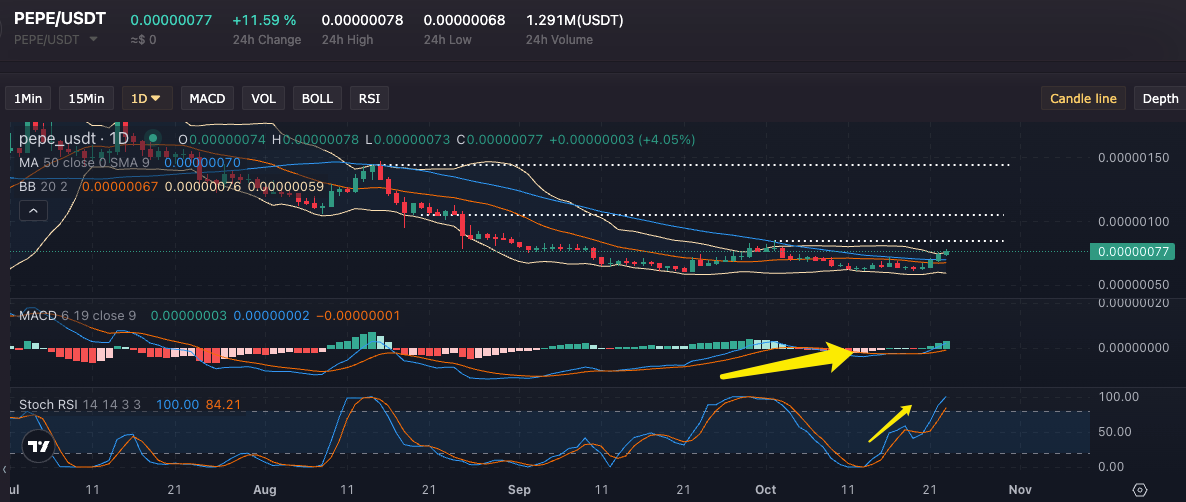
The current price of PEPE is US$0.00000077, with an increase of 11.59% in 24 hours; the trading volume in the past 24 hours was US$112 million, an increase of 30.76%.
Judging from the daily chart, PEPE has a MACD bottom divergence signal at a low level, and the Bollinger Bands have narrowed. The current price has risen from the bottom of the Bollinger Bands to near the upper track. Considering that ETH is currently rising well, once it stabilizes at a high level, short-term There is a greater chance that PEPE will break through $0.00000086. If it can hold on to this position, it is expected to test $0.000001. Support is $0.00000068 – $0.00000070.
Personal opinion, for reference only.
Click to trade : https://www.lbank.com/en-US/trade/pepe_usdt/
4. Research on hot projects (data from LBank / Dextool / OKLINK / Scopescan)
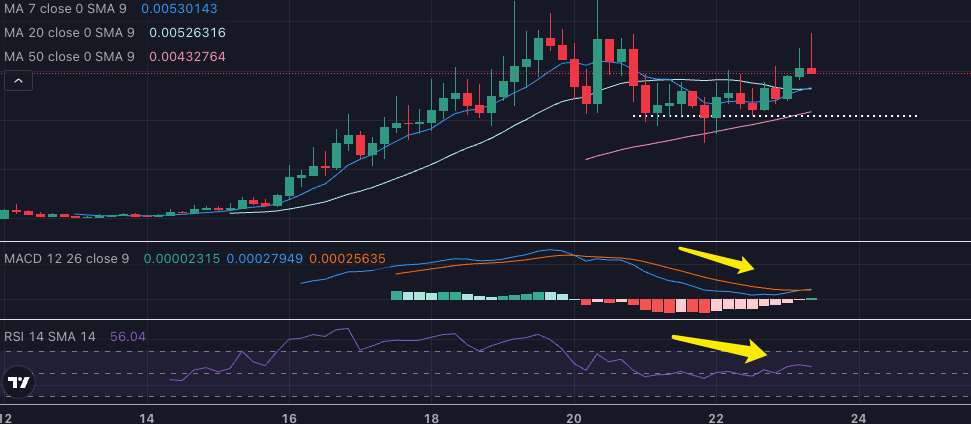
$JOE1
The current price is US$0.006342. It has been online for 11 days, with an increase of 26.89% within 24 hours. The 24-hour trading volume of the largest pool in DEX is US$1.58 million, and the size of the liquidity pool is approximately US$384,000.
Judging from the data, there are 2,342 wallet holders, and the chip dispersion is good; DEX wallets are mainly outflows, and some non-exchange wallets in the Top 20 have some changes.


The project has 2,362 Twitter followers, is currently moderately active, and has 801 TG members.
Judging from the 4-hour chart, the MACD and RSI top divergence signals have appeared on the technical indicators. In the short term, pay attention to the trend at the 20 and 50-day moving averages.
Personal opinion, for reference only.
Click to trade : https://www.lbank.com/en-US/trade/joe1_usdt/
$REKT
The current price of REKT is US$9.7098. It has been online for 4 days, with an increase of 7.49% in 24 hours. The 24-hour trading volume in DEX is US$1.218 million, and the liquidity pool size is approximately US$466,000. The 24-hour trading volume in CEX is $880,000.
Judging from the data, the number of wallet holders is 1,410, which has not changed much in recent days. The chips are currently well dispersed, with the top 10 wallets holding 22.97% of the chips; The non-exchange wallets in the Top 20 have more outflows.


From the 1-hour chart, REKT has a MACD bottom divergence signal, and the price is running near the middle track of the Bollinger Bands. In the short term, there is the possibility of a breakthrough. It is recommended to pay attention to the trend near 10.7-11.4 US dollars, with the support level of 8.5 US dollars.

Personal opinion, for reference only.
Click to trade : https://www.lbank.com/en-US/trade/rekt_usdt/